FigureDraft

UN ESPACIO PARA LA COMUNICACIÓN CIENTÍFICA

Generador de figuras científicas con IA

Explica tu investigación con una ilustración científica clara. Describe la idea, confirma los detalles y conviértela en un borrador visual.

Para ilustraciones explicativas, no para pruebas experimentales.

01 / Describe tu figura

Etiquetas, tamaño e instrucciones visuales

La extracción envía tu resumen, y la generación de imágenes tu descripción confirmada, al proveedor seleccionado. Envía solo investigaciones que estés autorizado a compartir con ese proveedor. Proveedor de procesamiento actual: Qianwen AI (maas.qianwenaiapi.com).Política de privacidad

Cada imagen generada correctamente consume 1 crédito, incluidas las nuevas versiones. Las tareas fallidas liberan los créditos reservados. La descarga en PNG no consume créditos adicionales.

Ejemplos seleccionados de figuras científicas

Los PNG originales son resultados reales de FigureDraft a partir de entradas de demostración en inglés. Los redibujos externos se etiquetan por separado. Las notas describen limitaciones visibles; ningún ejemplo ha recibido revisión científica independiente.

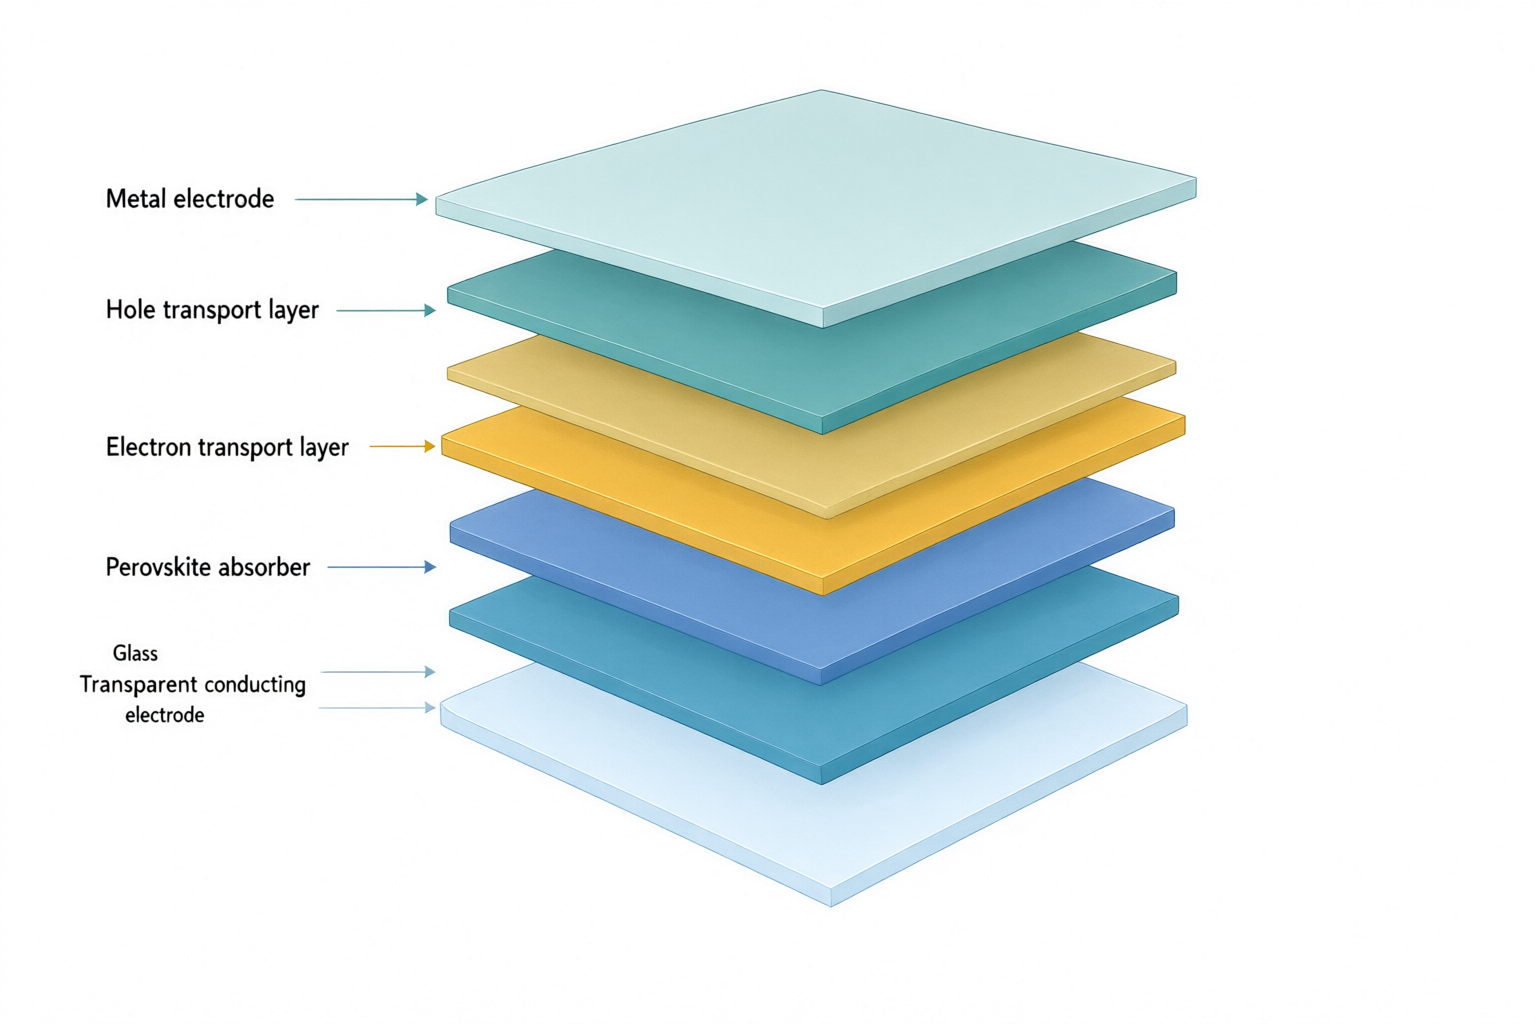
Exploded solar cell stack with labels for glass, transparent electrode, electron transport, perovskite, hole transport and metal.
PNG originalqwen-image-3.0 · 1536 × 1024

Referencia redibujada externamente
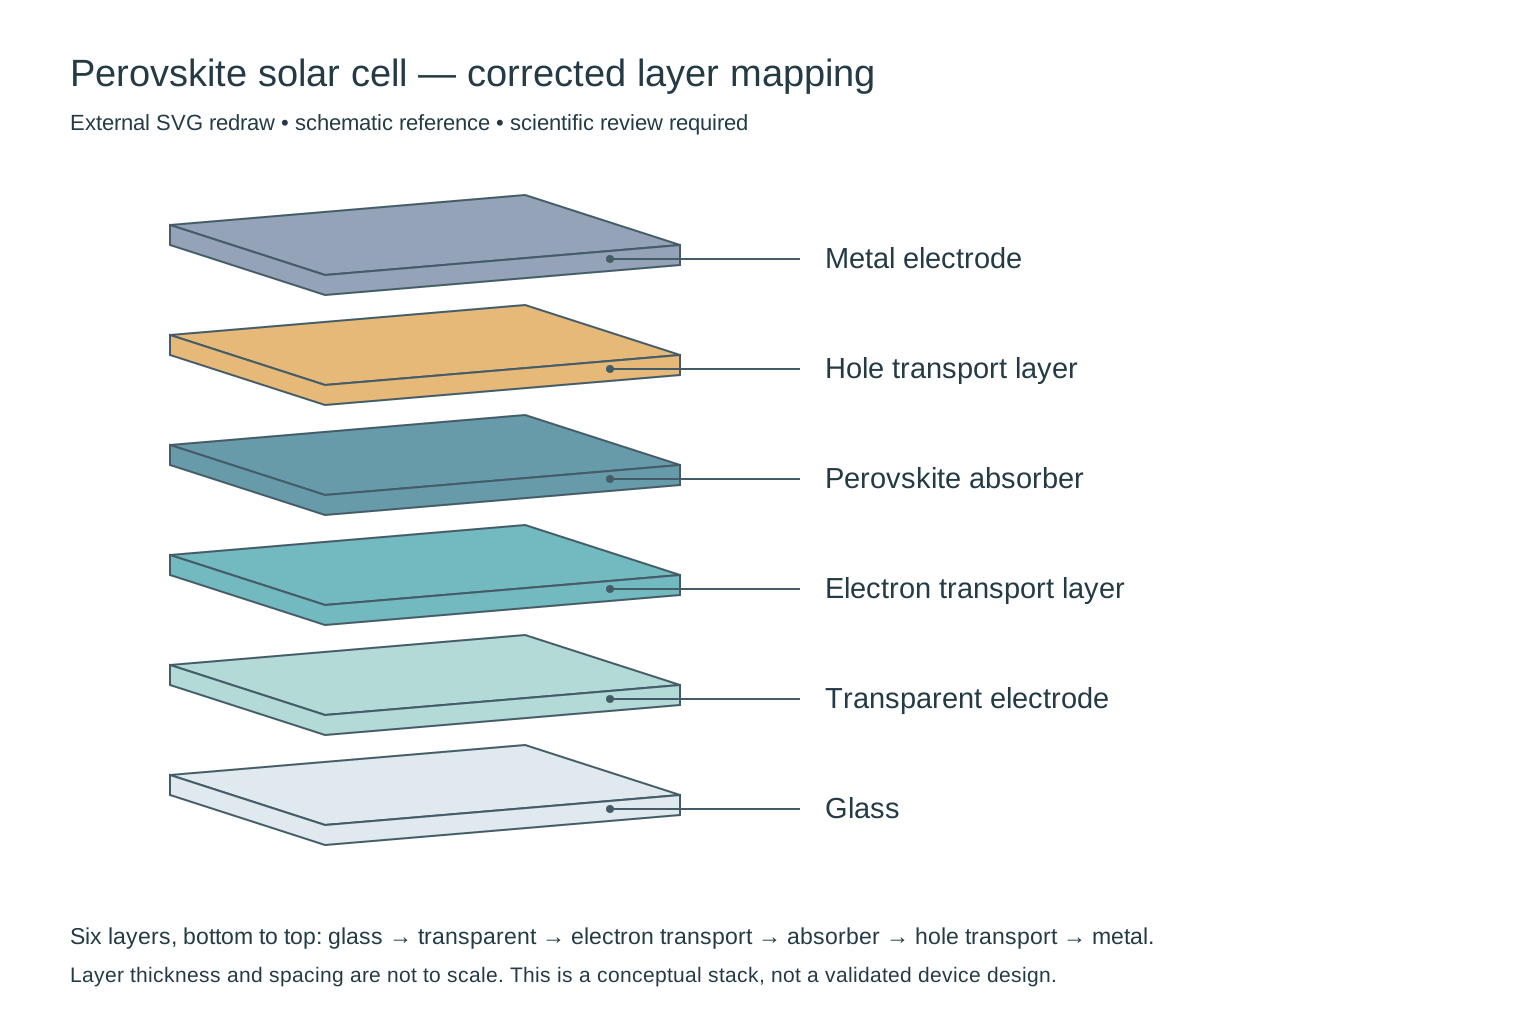
External redraw of exactly six solar-cell layers, from glass at the bottom to metal at the top, with each label connected to its own layer.
Redibujo SVG externo para comparar; no es una salida directa del producto ni una función de edición integrada. Requiere revisión científica.

Imagen científica

Perovskite solar cell layers

Notas de revisión

Needs correction: the output adds a seventh slab and does not preserve the requested layer-to-label mapping. In particular, check the electron-transport/perovskite order and the two bottom labels. This is a composition draft, not a validated device architecture; thickness is not to scale.

Referencia redibujada externamente

Removed the extra slab, restored the requested six-layer sequence and attached each leader to its matching layer. Thickness and spacing remain schematic; this does not validate a particular device architecture.

Entrada y contenido confirmado
Concepto de investigación
An exploded three-quarter cutaway of a conceptual planar perovskite solar cell. Show exactly six separate solid flat slabs, one slab per material, with equal gaps and no internal textures or additional sublayers.
Objetos que se deben incluir
Glass substrate; transparent conducting electrode; electron transport layer; perovskite absorber; hole transport layer; metal electrode.
Relaciones y flechas
Stack exactly six layers in the listed order, from glass at the bottom to metal at the top. Connect each label to the middle of its corresponding slab using a thin leader line without arrowheads. Layer thickness is schematic, not to scale.
Etiquetas exactas · opcional
Glass; Transparent electrode; Electron transport layer; Perovskite absorber; Hole transport layer; Metal electrode
Instrucciones visuales · opcional
Minimal textbook diagram with ample whitespace and teal, blue and amber colors. Print ONLY the short labels explicitly listed in the content. No subtitles, paragraphs, footnotes or extra words. These are drawing directions, not text to display.
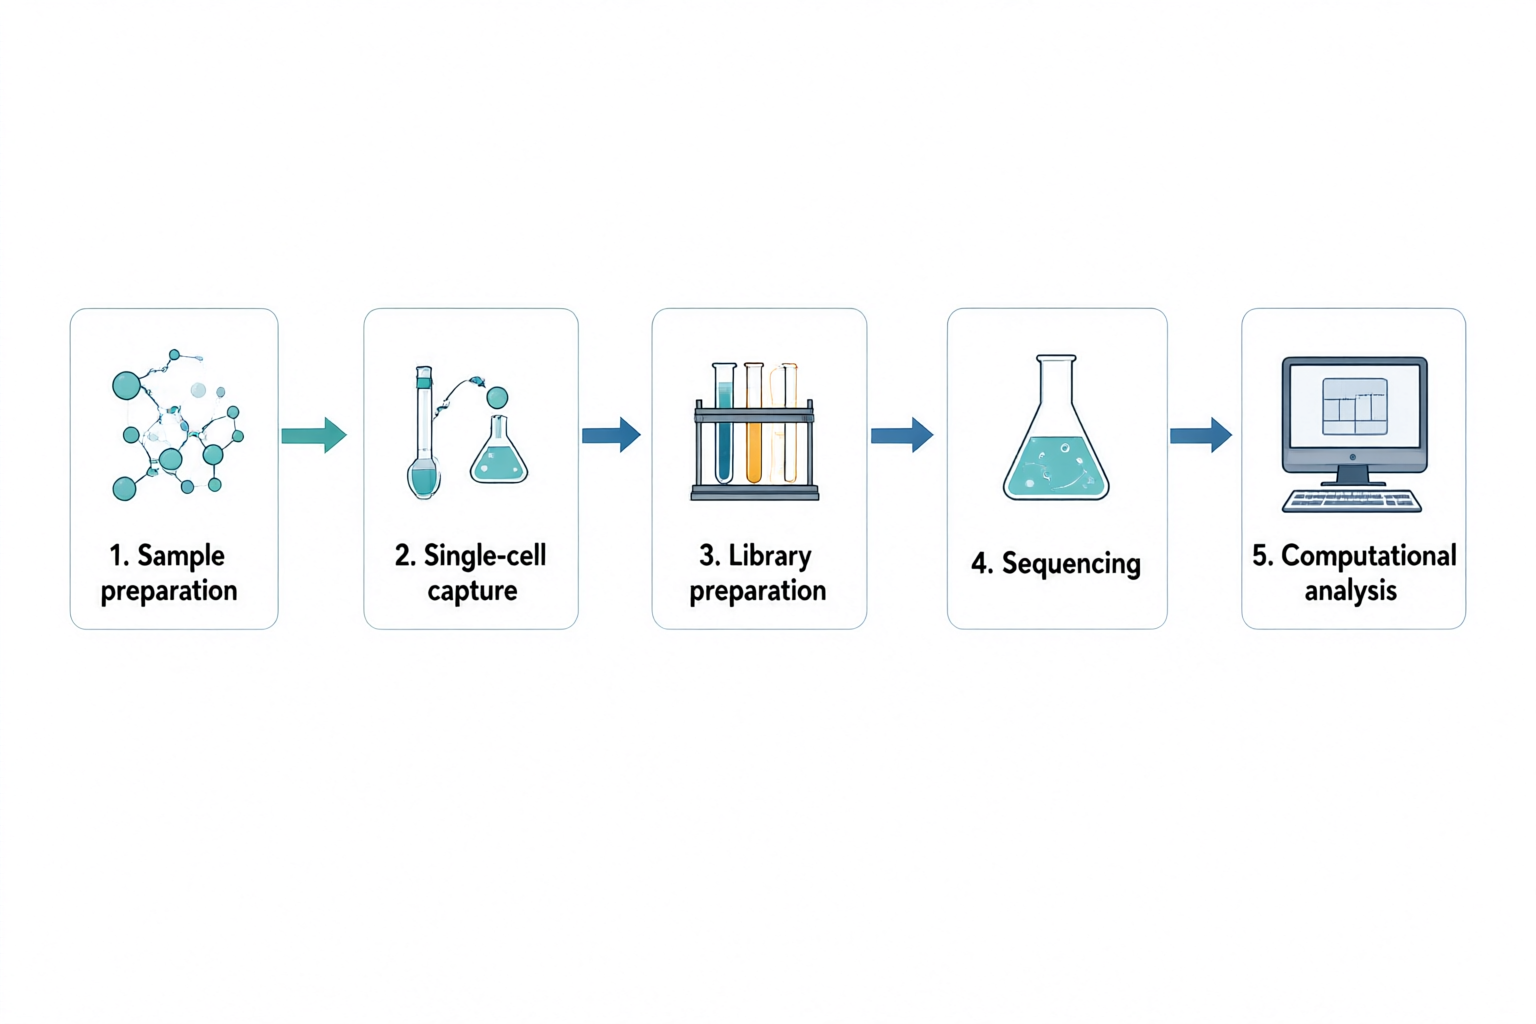
Five panels connected left to right: sample preparation, single-cell capture, library preparation, sequencing and computational analysis.
PNG originalqwen-image-3.0 · 1536 × 1024

Ilustración científica

Single-cell RNA sequencing workflow

Notas de revisión

The five labels and four connecting arrows follow the requested left-to-right order. The sequencing stage uses a generic flask rather than a sequencing instrument. Replace that icon for a technical methods figure; this overview does not specify an assay protocol or show measured data.

Entrada y contenido confirmado
Concepto de investigación
A high-level five-step workflow for single-cell RNA sequencing. Show a left-to-right sequence with numbered panels and one clear arrow between neighboring steps. Do not depict real sequencing measurements or an actual clustering result.
Objetos que se deben incluir
Sample preparation; single-cell capture; library preparation; sequencing; computational analysis.
Relaciones y flechas
Sample preparation leads to single-cell capture, then library preparation, sequencing and computational analysis. Use simple lab icons and a computer icon for the final stage. No branches or backward arrows.
Etiquetas exactas · opcional
1. Sample preparation; 2. Single-cell capture; 3. Library preparation; 4. Sequencing; 5. Computational analysis
Instrucciones visuales · opcional
Minimal textbook diagram with ample whitespace and teal, blue and amber colors. Print ONLY the short labels explicitly listed in the content. No subtitles, paragraphs, footnotes or extra words. These are drawing directions, not text to display.
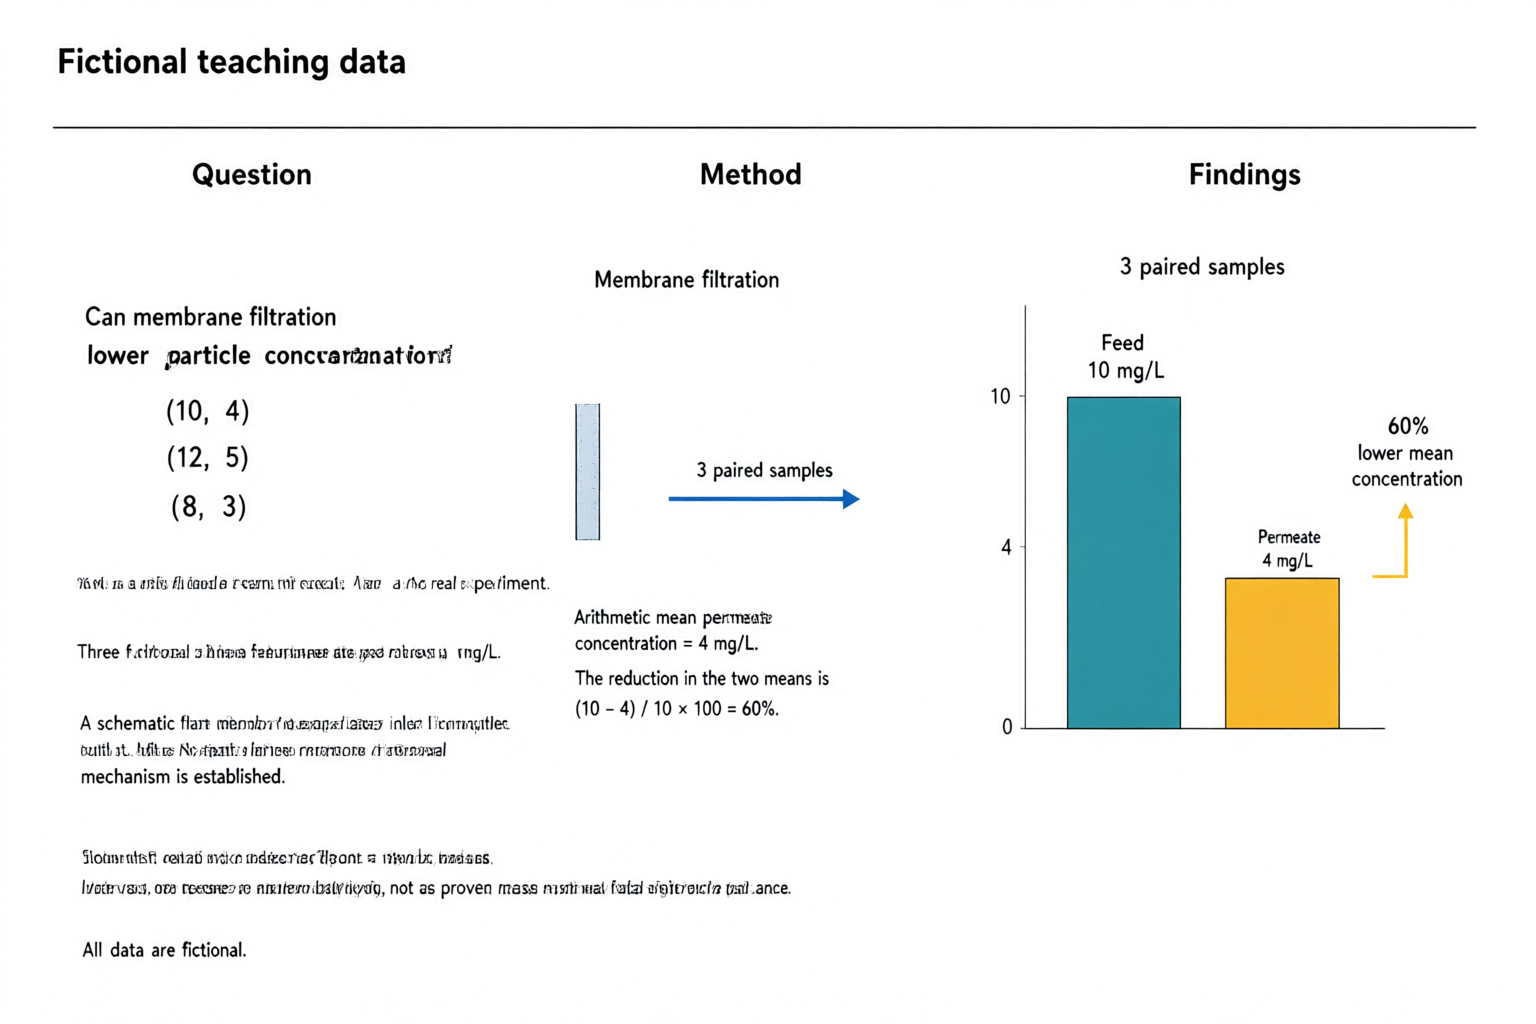
AI-generated fictional teaching abstract with question, filtration method and a zero-baseline chart showing feed at 10 mg/L and permeate at 4 mg/L, with a 60 percent lower mean.
PNG originalqwen-image-3.0 · 1536 × 1024

Referencia redibujada externamente

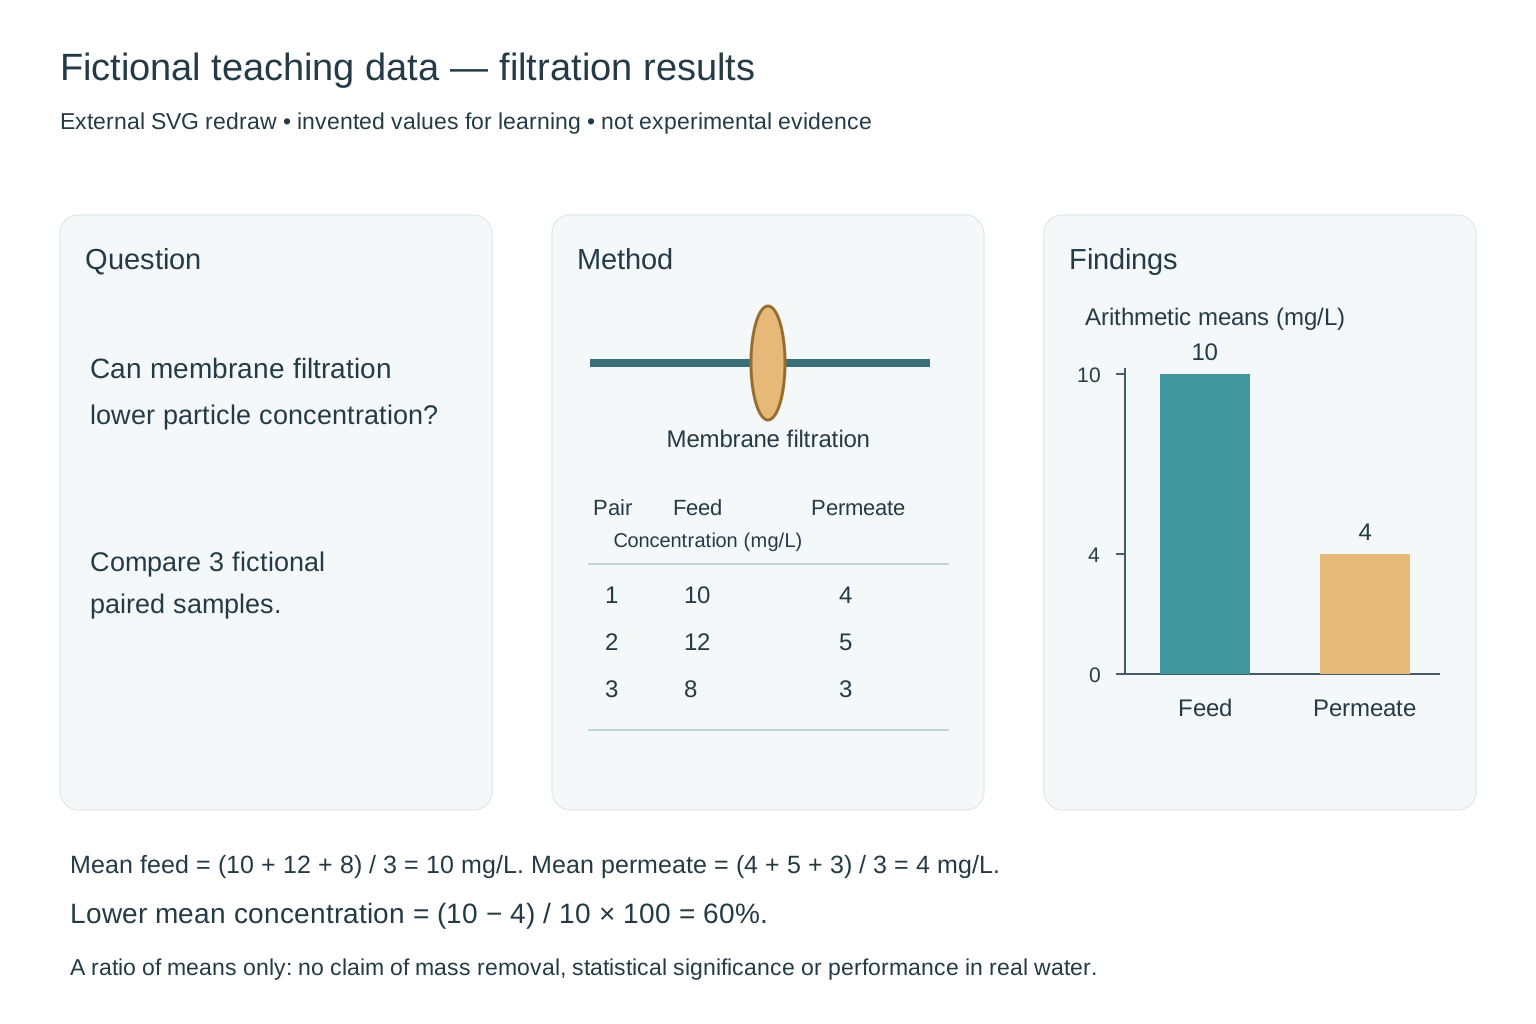
External redraw of a fictional filtration abstract: three paired concentrations 10/4, 12/5 and 8/3 mg/L, arithmetic means 10 and 4, and a chart with a zero baseline and 60 percent lower mean concentration.
Redibujo SVG externo para comparar; no es una salida directa del producto ni una función de edición integrada. Requiere revisión científica.

Resumen gráfico

Filtration results — fictional teaching data

Notas de revisión

Fictional teaching data, not experimental evidence. The three feed/permeate pairs are (10, 4), (12, 5), (8, 3) mg/L. Their means are 10 and 4 mg/L, so (10 − 4) / 10 × 100 = 60% lower mean concentration. The original chart preserves these values and a zero baseline, but the extra small text is malformed and the membrane apparatus is incomplete. The 60% is a ratio of means, not proof of mass removal, a mean of individual percentages or statistical significance.

Referencia redibujada externamente

Replaced malformed text with a clear question, a schematic membrane and the complete paired teaching dataset. Redrew the two bars on a shared zero baseline with heights in a 10:4 ratio. Both the figure and its caption identify the data as fictional; no error bars or significance claim are invented.

Entrada y contenido confirmado
Pregunta de investigación
Can membrane filtration lower particle concentration? This is a fictional teaching example, not a real experiment.
Método
Three fictional paired feed/permeate concentrations in mg/L: (10, 4), (12, 5), (8, 3). A schematic flat membrane separates inlet from outlet. No statistical inference or removal mechanism is established.
Hallazgos principales
Arithmetic mean feed concentration = 10 mg/L; arithmetic mean permeate concentration = 4 mg/L. The reduction in the two means is (10 - 4) / 10 × 100 = 60%. Show this as lower mean concentration, not as proven mass removal or statistical significance. All data are fictional.
Instrucciones visuales · opcional
Minimal textbook diagram with ample whitespace and teal, blue and amber colors. Print ONLY the short labels explicitly listed in the content. No subtitles, paragraphs, footnotes or extra words. These are drawing directions, not text to display. Prominently label the whole figure "Fictional teaching data". Three panels: Question, Method, Findings. ONLY additional labels: "Membrane filtration", "3 paired samples", "Feed: 10 mg/L", "Permeate: 4 mg/L", "60% lower mean concentration". Use a simple two-bar chart with a zero baseline, feed bar height 10 and permeate bar height 4. No other numerical claims.
EMPIEZA CON UNA IDEA

Prueba una descripción de investigación

Son ejemplos de entrada, no resultados generados ni investigaciones de clientes.

DE LA DESCRIPCIÓN AL BORRADOR

Ilustraciones científicas con un paso de revisión

Describe tu concepto de investigación y detalla los objetos, las relaciones y las etiquetas. Confirma esos detalles antes de que el modelo genere una imagen. Revisa el significado científico y el texto renderizado antes de descargarla.

  1. Describe el concepto y sus objetos
  2. Confirma las etiquetas y las relaciones
  3. Genera, revisa el contenido científico y descarga

Imágenes científicas, ilustraciones y diagramas conceptuales

Crea imágenes de conceptos científicos o ilustraciones de métodos y relaciones en el mismo espacio. Describe flechas y grupos para organizar un diagrama conceptual. El resultado es un borrador PNG, sin edición directa de nodos ni conectores.

Mejora tu descripción y genera una nueva versión

Cambia la redacción, las instrucciones de composición o las etiquetas y genera una nueva imagen. Esta primera versión produce imágenes ráster PNG; no permite editar directamente texto, vectores ni elementos. Cada nueva generación puede cambiar toda la composición.

Resumen gráfico

¿Necesitas un resumen gráfico?

Convierte el resumen de tu investigación en una narración visual clara. Revisa la pregunta, el método y los hallazgos antes de generar tu resumen gráfico.

Crear un resumen gráfico

Revisa tu figura antes de usarla

Revisa cada etiqueta, flecha, número y afirmación científica antes de usar la imagen. Es un borrador, no una prueba experimental.

Revisa el significado científico y el texto, y comprueba los requisitos de la revista sobre IA, licencias y declaración de uso. Las imágenes generadas no son automáticamente exactas, aprobadas por una revista ni aptas como prueba experimental.

Preguntas frecuentes

¿Qué tipos de figuras científicas puedo crear?

Crea ilustraciones explicativas de conceptos, métodos y relaciones de investigación, u organiza la investigación proporcionada en un resumen gráfico. Esta herramienta no representa conjuntos de datos ni genera pruebas experimentales.

¿Esta herramienta genera datos o imágenes experimentales?

Crea ilustraciones explicativas, no mediciones, micrografías, escaneos ni pruebas experimentales. Describe solo los conceptos y relaciones que quieres explicar y verifica cada afirmación científica antes de usar el resultado.

¿Puedo editar el texto y las etiquetas?

Puedes revisar la descripción y las etiquetas exactas antes de generar otra imagen. Esta versión no permite editar directamente píxeles, capas de texto, vectores ni elementos individuales.

¿Qué formatos y tamaños de exportación se admiten?

Las descargas PNG están disponibles en 1024 × 1024, 1536 × 1024 y 1024 × 1536 píxeles. No se ofrecen exportaciones SVG ni PPTX. Descarga pronto las imágenes porque los enlaces del proveedor caducan.