FigureDraft

연구 소통을 위한 작업 공간

AI 과학 도해 생성기

명확한 과학 일러스트로 연구를 설명하세요. 아이디어를 입력하고 세부 사항을 확인해 시각적 초안으로 바꾸세요.

설명용 일러스트이며 실험 증거가 아닙니다.

01 / 도해 설명

라벨, 이미지 크기 및 시각적 지침

추출 시 요약이, 이미지 생성 시 확인된 설명이 선택한 제공업체로 전송됩니다. 해당 제공업체와 공유할 권한이 있는 연구만 제출하세요. 현재 처리 제공업체: Qianwen AI (maas.qianwenaiapi.com).개인정보 처리방침

새 버전을 포함해 성공적으로 생성된 이미지마다 크레딧 1개를 사용합니다. 실패한 작업은 예약된 크레딧을 해제합니다. PNG 다운로드에는 추가 크레딧이 들지 않습니다.

엄선한 과학 그림 예시

원본 PNG는 영어 시연 입력으로 FigureDraft가 실제 생성한 결과입니다. 외부에서 다시 그린 그림은 별도로 표시합니다. 검토 메모는 눈에 보이는 문제와 한계를 설명하며, 모든 예시는 독립적인 과학적 검토를 받지 않았습니다.

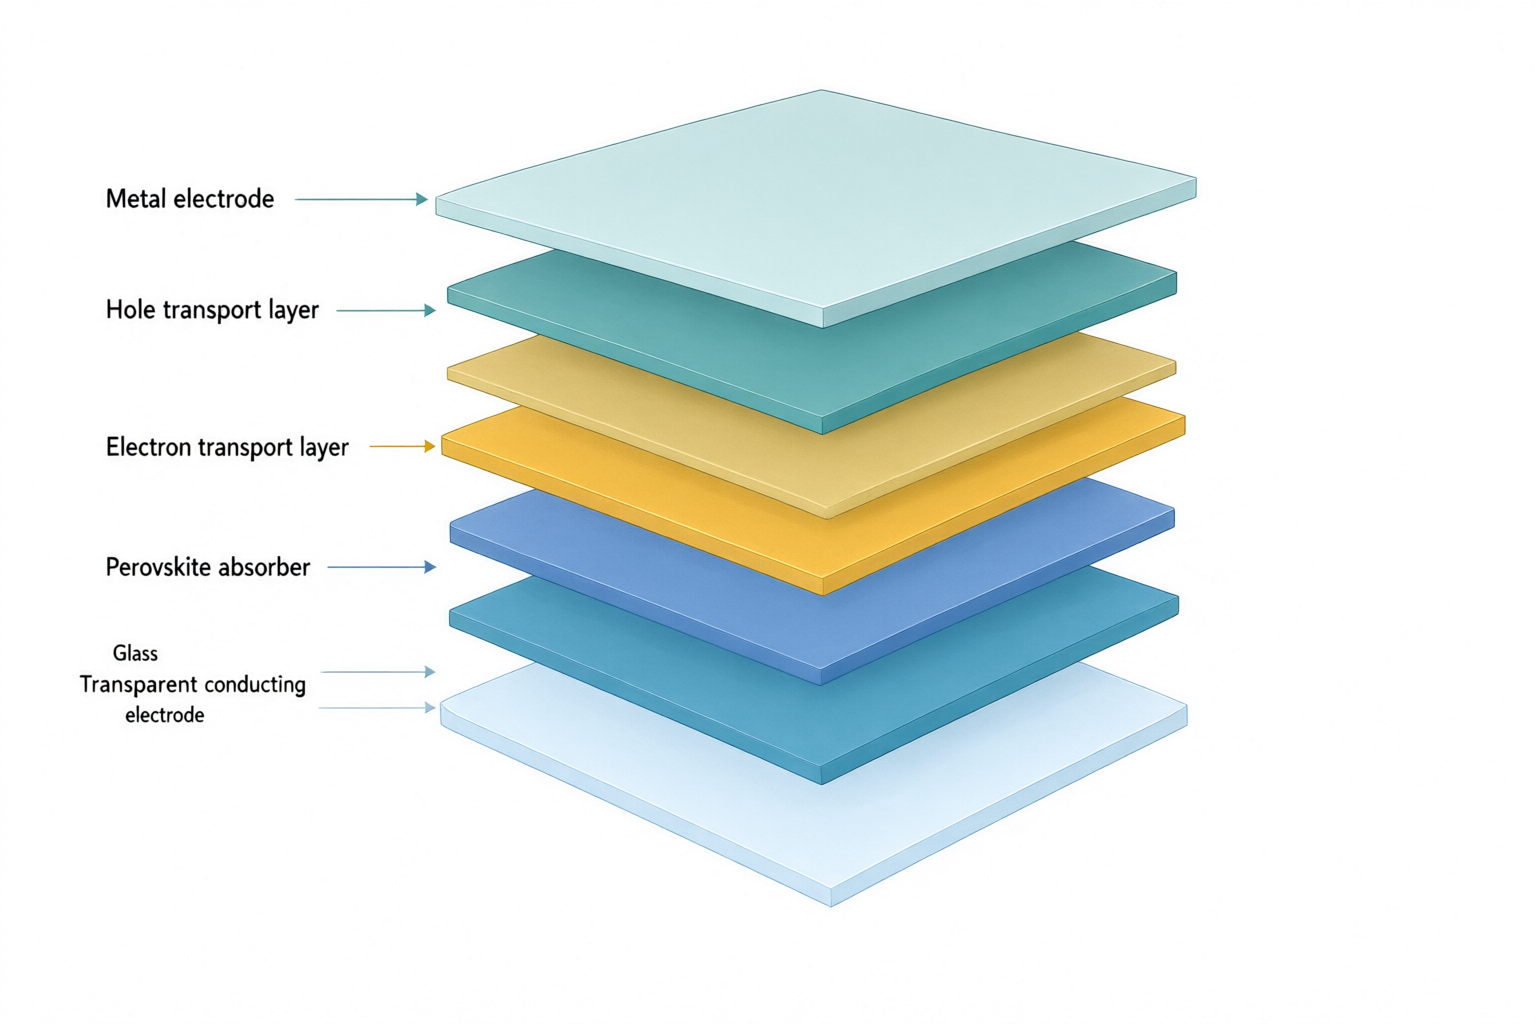
Exploded solar cell stack with labels for glass, transparent electrode, electron transport, perovskite, hole transport and metal.
원본 PNGqwen-image-3.0 · 1536 × 1024

외부에서 다시 그린 참고 그림

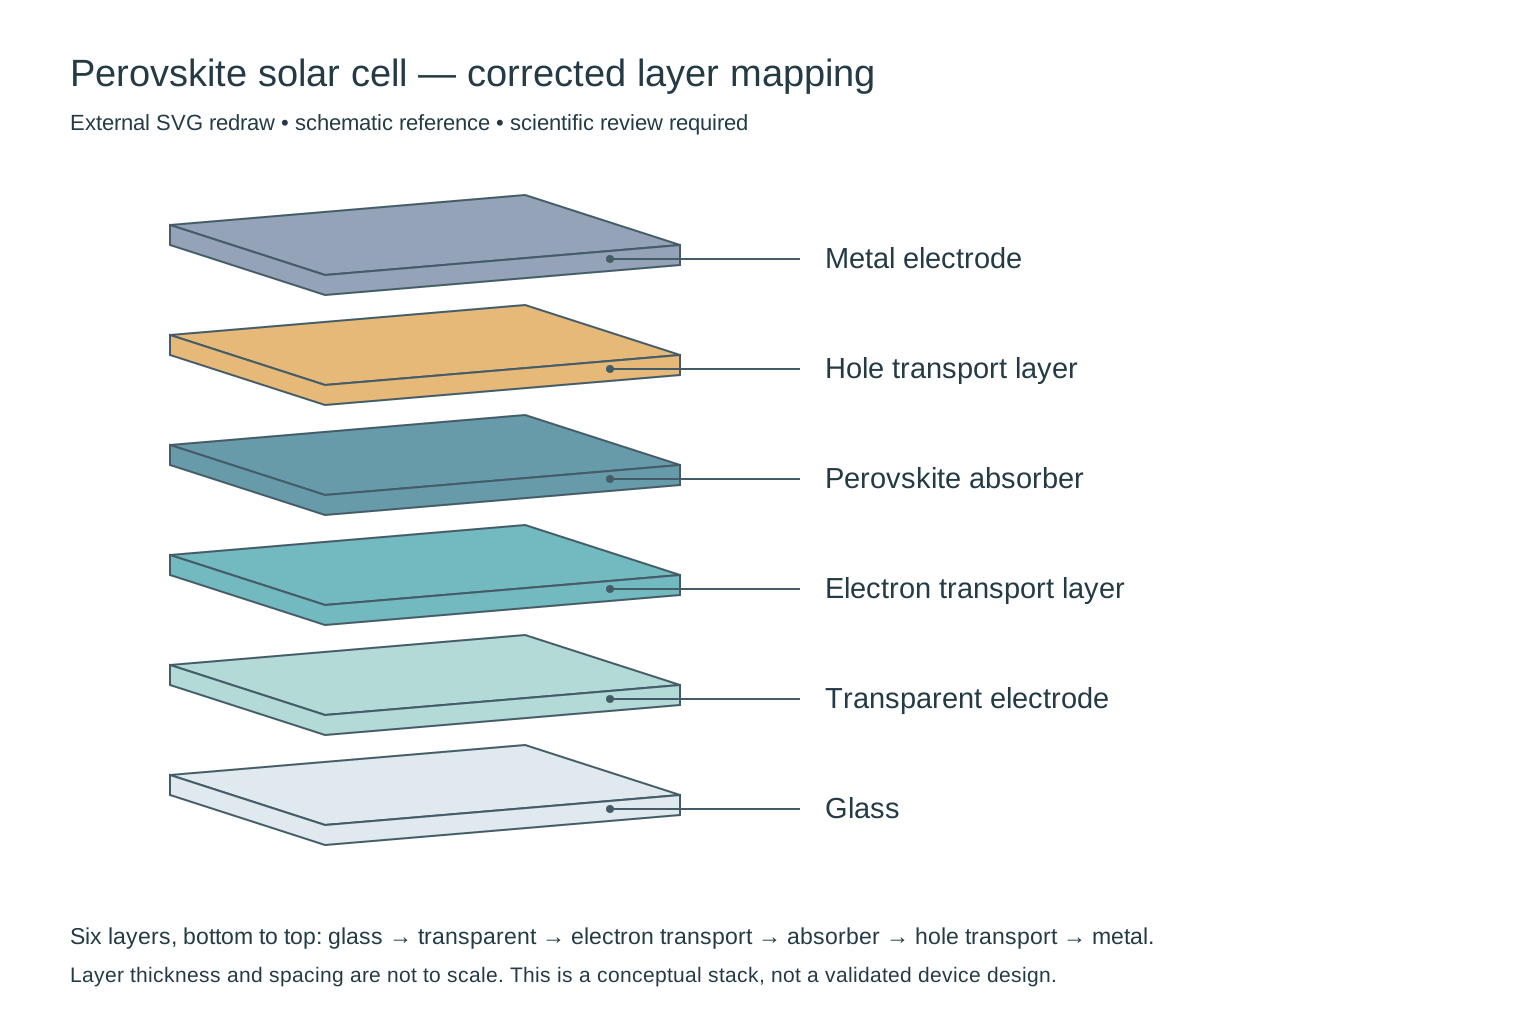
External redraw of exactly six solar-cell layers, from glass at the bottom to metal at the top, with each label connected to its own layer.
비교를 위해 외부에서 다시 그린 SVG이며, 제품의 직접 출력이나 제품 내 편집 기능이 아닙니다. 과학적 검토가 여전히 필요합니다.

과학 이미지

Perovskite solar cell layers

검토 메모

Needs correction: the output adds a seventh slab and does not preserve the requested layer-to-label mapping. In particular, check the electron-transport/perovskite order and the two bottom labels. This is a composition draft, not a validated device architecture; thickness is not to scale.

외부에서 다시 그린 참고 그림

Removed the extra slab, restored the requested six-layer sequence and attached each leader to its matching layer. Thickness and spacing remain schematic; this does not validate a particular device architecture.

입력 및 확인한 내용
연구 개념
An exploded three-quarter cutaway of a conceptual planar perovskite solar cell. Show exactly six separate solid flat slabs, one slab per material, with equal gaps and no internal textures or additional sublayers.
포함할 대상
Glass substrate; transparent conducting electrode; electron transport layer; perovskite absorber; hole transport layer; metal electrode.
관계와 화살표
Stack exactly six layers in the listed order, from glass at the bottom to metal at the top. Connect each label to the middle of its corresponding slab using a thin leader line without arrowheads. Layer thickness is schematic, not to scale.
정확한 라벨 문구 · 선택 사항
Glass; Transparent electrode; Electron transport layer; Perovskite absorber; Hole transport layer; Metal electrode
시각적 지침 · 선택 사항
Minimal textbook diagram with ample whitespace and teal, blue and amber colors. Print ONLY the short labels explicitly listed in the content. No subtitles, paragraphs, footnotes or extra words. These are drawing directions, not text to display.
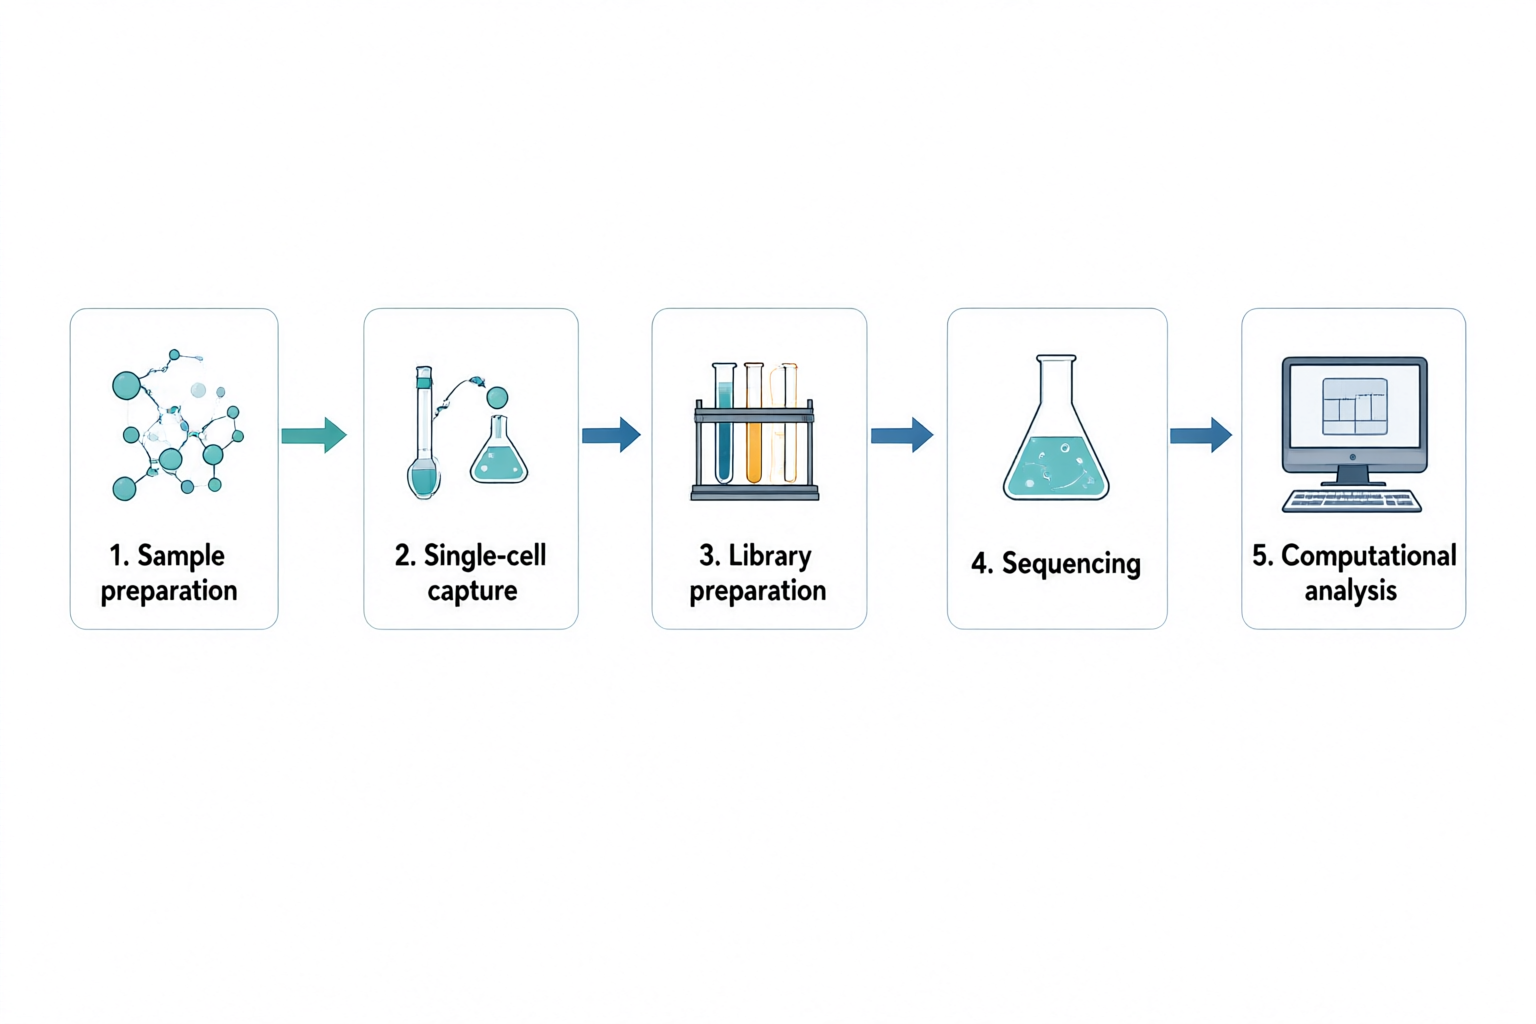
Five panels connected left to right: sample preparation, single-cell capture, library preparation, sequencing and computational analysis.
원본 PNGqwen-image-3.0 · 1536 × 1024

과학 일러스트

Single-cell RNA sequencing workflow

검토 메모

The five labels and four connecting arrows follow the requested left-to-right order. The sequencing stage uses a generic flask rather than a sequencing instrument. Replace that icon for a technical methods figure; this overview does not specify an assay protocol or show measured data.

입력 및 확인한 내용
연구 개념
A high-level five-step workflow for single-cell RNA sequencing. Show a left-to-right sequence with numbered panels and one clear arrow between neighboring steps. Do not depict real sequencing measurements or an actual clustering result.
포함할 대상
Sample preparation; single-cell capture; library preparation; sequencing; computational analysis.
관계와 화살표
Sample preparation leads to single-cell capture, then library preparation, sequencing and computational analysis. Use simple lab icons and a computer icon for the final stage. No branches or backward arrows.
정확한 라벨 문구 · 선택 사항
1. Sample preparation; 2. Single-cell capture; 3. Library preparation; 4. Sequencing; 5. Computational analysis
시각적 지침 · 선택 사항
Minimal textbook diagram with ample whitespace and teal, blue and amber colors. Print ONLY the short labels explicitly listed in the content. No subtitles, paragraphs, footnotes or extra words. These are drawing directions, not text to display.
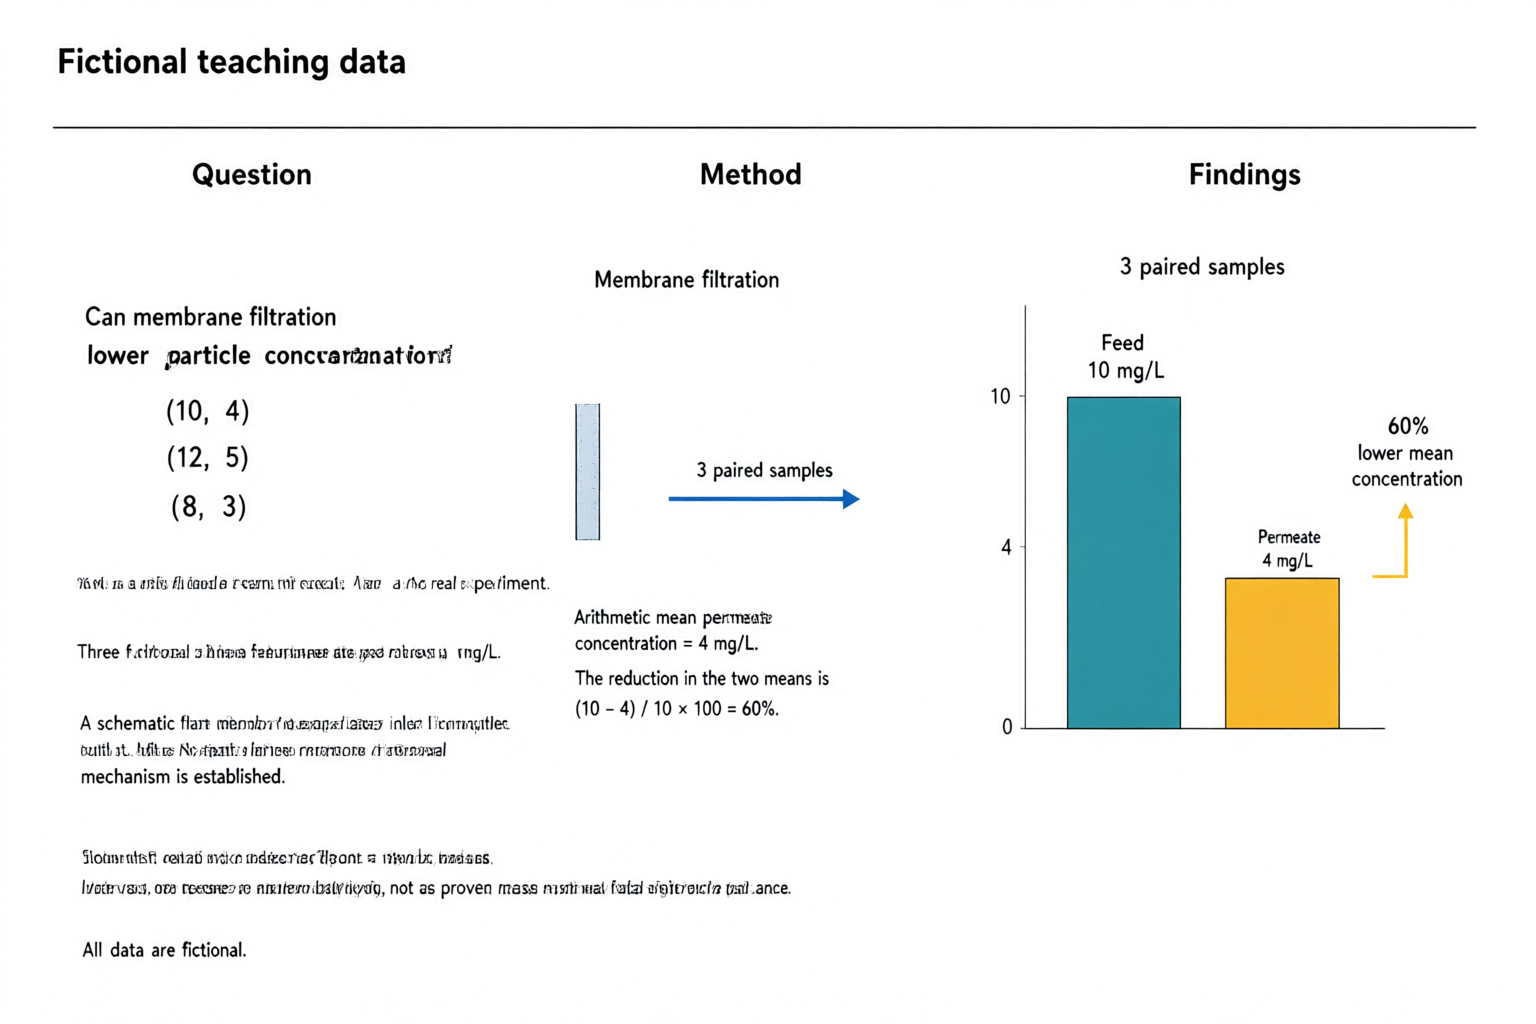
AI-generated fictional teaching abstract with question, filtration method and a zero-baseline chart showing feed at 10 mg/L and permeate at 4 mg/L, with a 60 percent lower mean.
원본 PNGqwen-image-3.0 · 1536 × 1024

외부에서 다시 그린 참고 그림

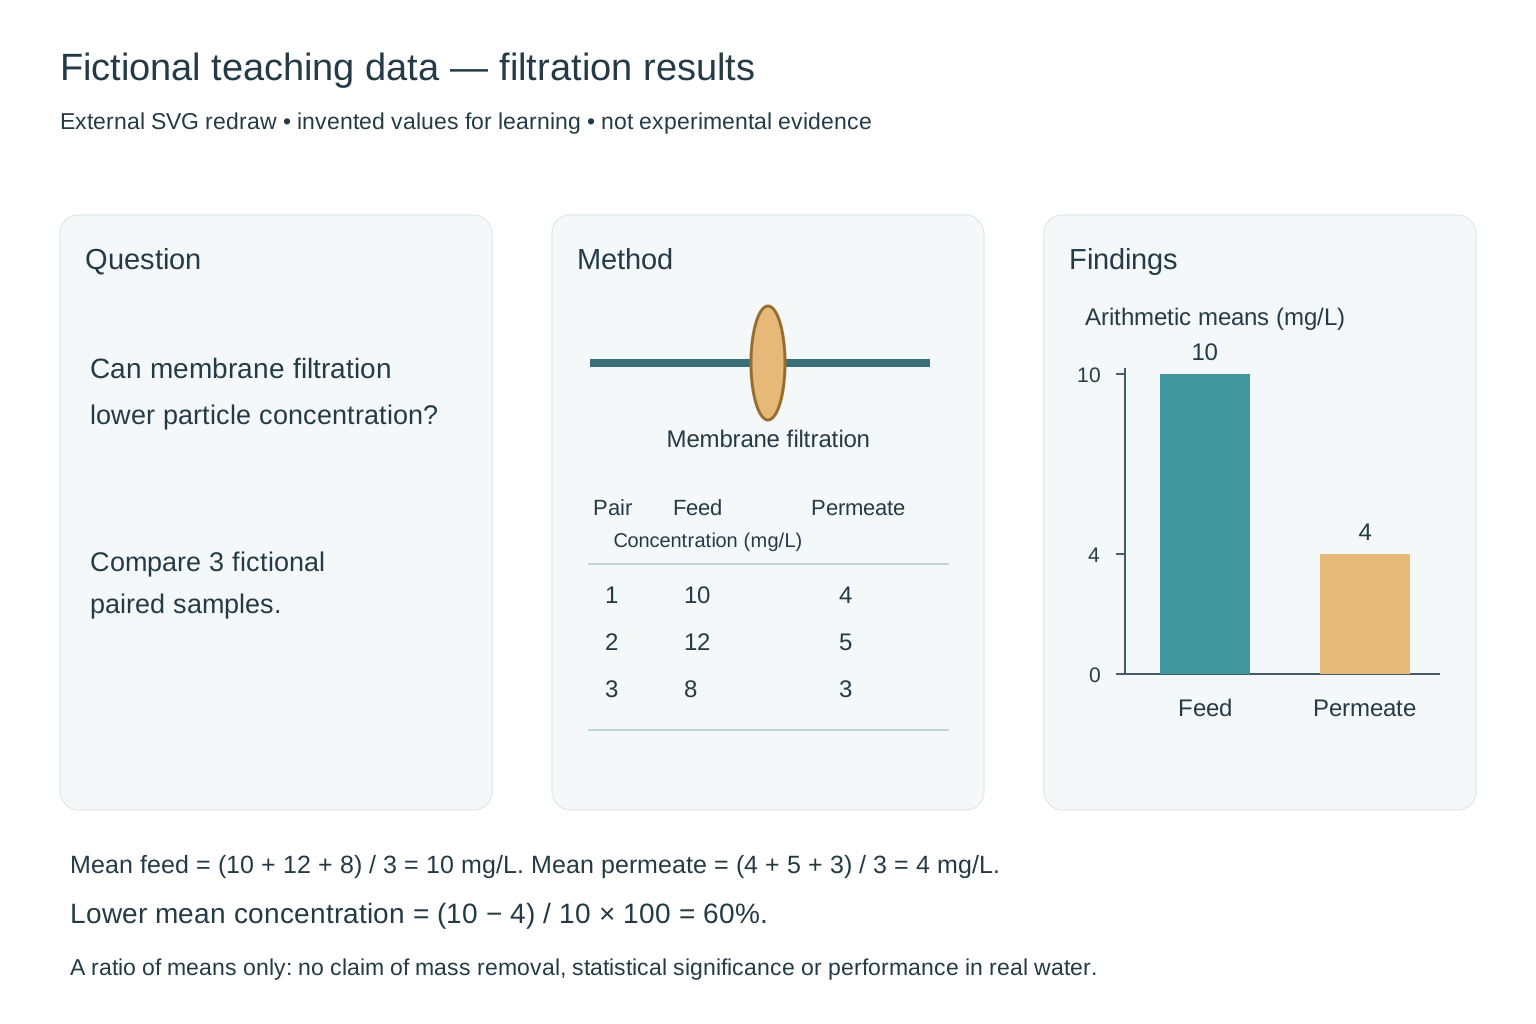
External redraw of a fictional filtration abstract: three paired concentrations 10/4, 12/5 and 8/3 mg/L, arithmetic means 10 and 4, and a chart with a zero baseline and 60 percent lower mean concentration.
비교를 위해 외부에서 다시 그린 SVG이며, 제품의 직접 출력이나 제품 내 편집 기능이 아닙니다. 과학적 검토가 여전히 필요합니다.

그래픽 초록

Filtration results — fictional teaching data

검토 메모

Fictional teaching data, not experimental evidence. The three feed/permeate pairs are (10, 4), (12, 5), (8, 3) mg/L. Their means are 10 and 4 mg/L, so (10 − 4) / 10 × 100 = 60% lower mean concentration. The original chart preserves these values and a zero baseline, but the extra small text is malformed and the membrane apparatus is incomplete. The 60% is a ratio of means, not proof of mass removal, a mean of individual percentages or statistical significance.

외부에서 다시 그린 참고 그림

Replaced malformed text with a clear question, a schematic membrane and the complete paired teaching dataset. Redrew the two bars on a shared zero baseline with heights in a 10:4 ratio. Both the figure and its caption identify the data as fictional; no error bars or significance claim are invented.

입력 및 확인한 내용
연구 질문
Can membrane filtration lower particle concentration? This is a fictional teaching example, not a real experiment.
방법
Three fictional paired feed/permeate concentrations in mg/L: (10, 4), (12, 5), (8, 3). A schematic flat membrane separates inlet from outlet. No statistical inference or removal mechanism is established.
주요 결과
Arithmetic mean feed concentration = 10 mg/L; arithmetic mean permeate concentration = 4 mg/L. The reduction in the two means is (10 - 4) / 10 × 100 = 60%. Show this as lower mean concentration, not as proven mass removal or statistical significance. All data are fictional.
시각적 지침 · 선택 사항
Minimal textbook diagram with ample whitespace and teal, blue and amber colors. Print ONLY the short labels explicitly listed in the content. No subtitles, paragraphs, footnotes or extra words. These are drawing directions, not text to display. Prominently label the whole figure "Fictional teaching data". Three panels: Question, Method, Findings. ONLY additional labels: "Membrane filtration", "3 paired samples", "Feed: 10 mg/L", "Permeate: 4 mg/L", "60% lower mean concentration". Use a simple two-bar chart with a zero baseline, feed bar height 10 and permeate bar height 4. No other numerical claims.
아이디어로 시작하기

연구 프롬프트 사용해 보기

아래 내용은 데모 입력이며 생성 결과나 고객 연구가 아닙니다.

설명에서 초안으로

검토 단계를 포함한 과학 일러스트 제작

연구 개념을 설명하고 대상, 관계, 라벨을 구체적으로 적으세요. 모델이 이미지를 생성하기 전에 세부 사항을 확인하세요. 다운로드하기 전에 과학적 의미와 렌더링된 글자를 검토하세요.

  1. 개념과 대상 설명
  2. 라벨과 관계 확인
  3. 생성 후 과학적 내용 검토 및 다운로드

과학 이미지, 삽화 및 개념도

같은 작업 공간에서 과학 개념을 보여 주는 이미지나 연구 방법과 관계를 설명하는 삽화를 만드세요. 화살표와 그룹을 설명해 개념도를 구성할 수도 있습니다. 결과는 PNG 초안이며 노드나 연결선을 직접 편집하는 기능은 없습니다.

설명을 다듬고 새 버전 생성하기

문구, 레이아웃 지침, 라벨을 바꾸고 새 이미지를 생성할 수 있습니다. 이 초기 버전은 래스터 PNG 이미지를 만들며 텍스트, 벡터, 요소의 직접 편집은 지원하지 않습니다. 새로 생성할 때마다 전체 구도가 바뀔 수 있습니다.

그래픽 초록

그래픽 초록이 필요하신가요?

연구 요약을 명확한 시각적 이야기로 바꾸세요. 그래픽 초록 생성 전에 질문, 방법, 결과를 검토하세요.

그래픽 초록 만들기

사용 전에 도해를 검토하세요

사용 전에 모든 라벨, 화살표, 숫자, 과학적 주장을 확인하세요. 이 이미지는 초안이며 실험 증거가 아닙니다.

과학적 의미와 텍스트를 검토하고 투고할 학술지의 AI, 라이선스, 공개 요건을 확인하세요. 생성된 이미지의 정확성, 학술지 승인, 실험 증거로서의 적합성은 자동으로 보장되지 않습니다.

자주 묻는 질문

어떤 과학 도해를 만들 수 있나요?

연구 개념, 방법, 관계를 설명하는 일러스트를 만들거나 제공한 연구를 그래픽 초록으로 정리할 수 있습니다. 데이터셋을 그래프로 그리거나 실험 증거를 생성하는 도구는 아닙니다.

이 도구는 실험 데이터나 실험 이미지를 생성하나요?

설명용 삽화를 만들며 측정 데이터, 현미경 사진, 스캔 이미지 또는 실험 증거를 생성하지 않습니다. 설명하려는 개념과 관계만 작성하고 사용 전에 모든 과학적 표현을 확인하세요.

텍스트와 라벨을 편집할 수 있나요?

설명과 정확한 라벨 문구를 수정한 후 다른 이미지를 생성할 수 있습니다. 이 버전에서는 픽셀, 텍스트 레이어, 벡터, 개별 요소를 직접 편집할 수 없습니다.

어떤 내보내기 형식과 크기를 지원하나요?

1024 × 1024, 1536 × 1024, 1024 × 1536 픽셀의 PNG를 다운로드할 수 있습니다. SVG 및 PPTX 내보내기는 제공하지 않습니다. 제공업체 이미지 링크는 만료되므로 바로 다운로드하세요.