研究を伝えるワークスペース

AI 科学図生成ツール

分かりやすい科学イラストで研究を説明。アイデアを記入し、詳細を確認して視覚的な下書きにします。

説明用のイラストです。実験の証拠ではありません。

01 / 図を説明する

ラベル・画像サイズ・見た目の指定

抽出時には要約が、画像生成時には確認済みの説明が選択した提供元に送信されます。その提供元への共有が許可された研究のみ送信してください。 現在の処理提供元:Qianwen AI (maas.qianwenaiapi.com)。プライバシーポリシー

新しい版を含め、生成に成功した画像 1 枚につき 1 クレジットを使います。失敗したタスクでは予約済みクレジットが解放されます。PNG のダウンロードに追加クレジットは不要です。

厳選した科学図の作例

元の PNG は英語のデモ入力から FigureDraft が実際に生成したものです。外部で描き直した図は別途明示しています。確認メモには目に見える問題と制約を記載しています。いずれも独立した科学的検証は受けていません。

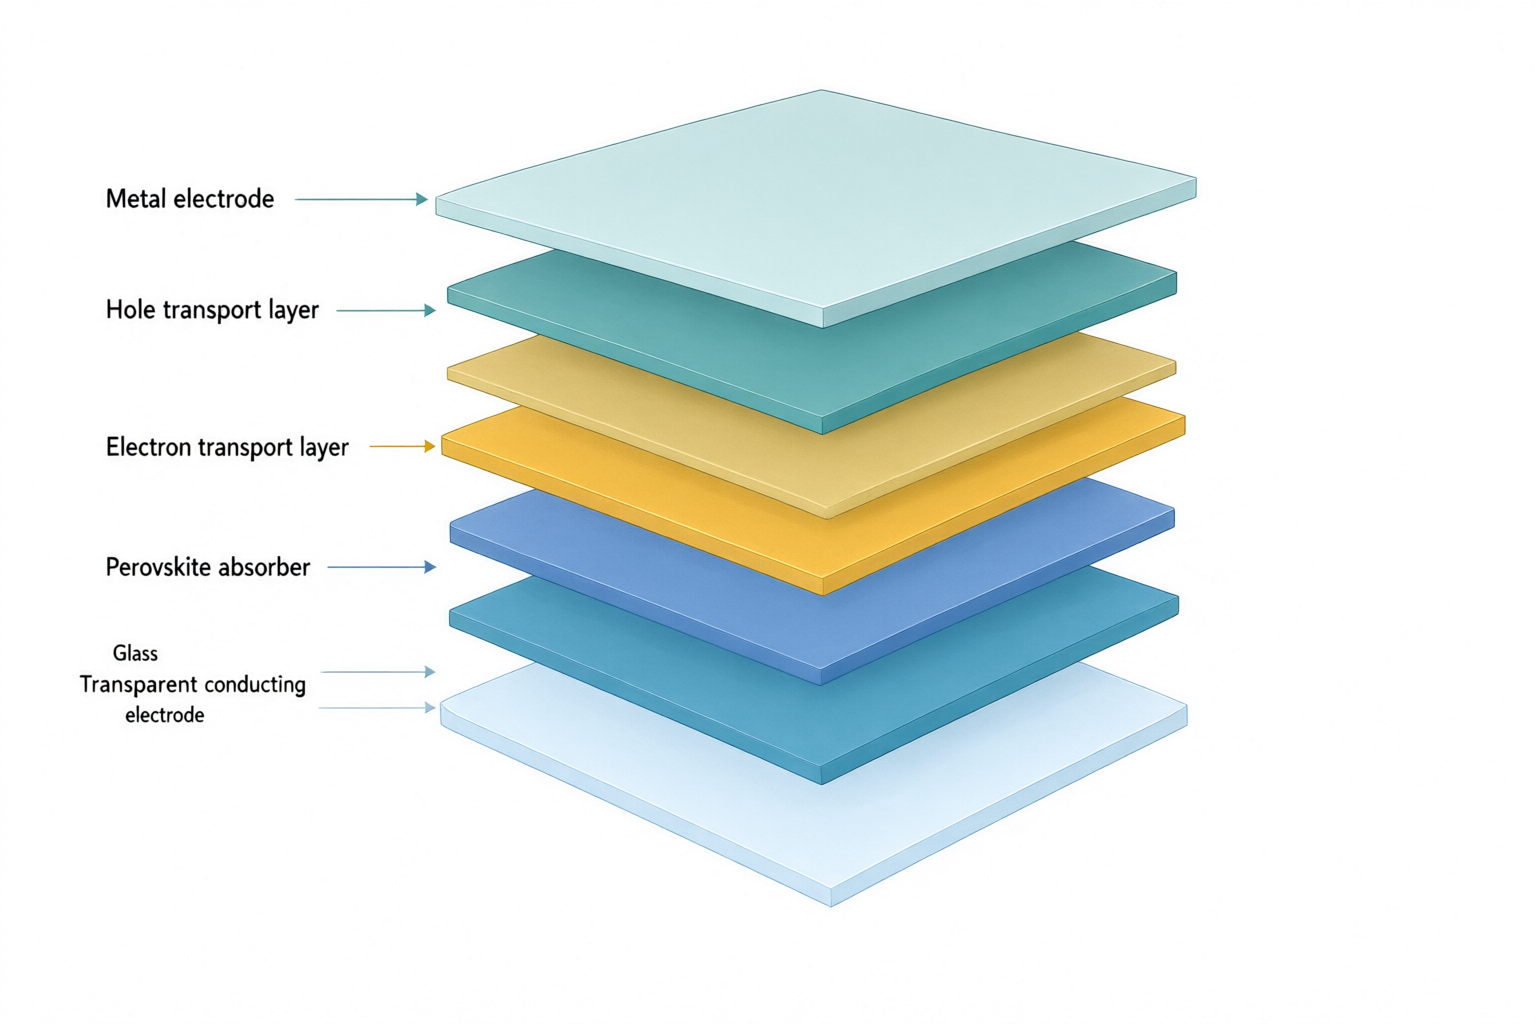
Exploded solar cell stack with labels for glass, transparent electrode, electron transport, perovskite, hole transport and metal.
元の PNGqwen-image-3.0 · 1536 × 1024

外部で描き直した参考図

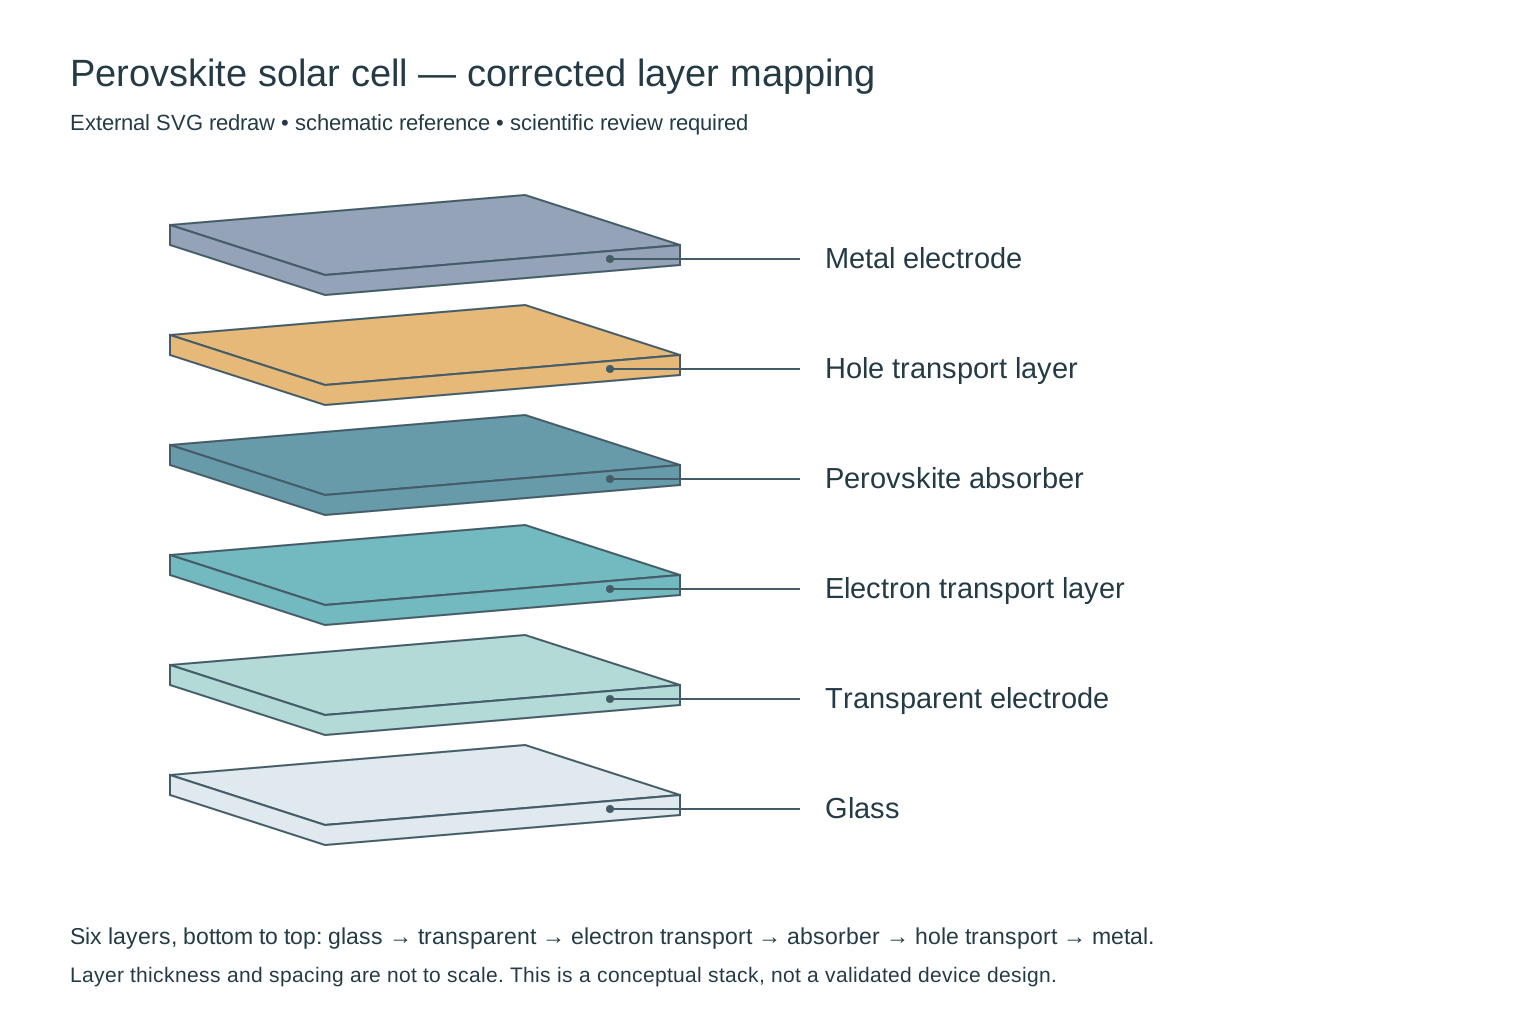
External redraw of exactly six solar-cell layers, from glass at the bottom to metal at the top, with each label connected to its own layer.
比較用に外部で描き直した SVG です。製品の直接出力や製品内の編集機能ではありません。科学的な確認は引き続き必要です。

科学画像

Perovskite solar cell layers

確認メモ

Needs correction: the output adds a seventh slab and does not preserve the requested layer-to-label mapping. In particular, check the electron-transport/perovskite order and the two bottom labels. This is a composition draft, not a validated device architecture; thickness is not to scale.

外部で描き直した参考図

Removed the extra slab, restored the requested six-layer sequence and attached each leader to its matching layer. Thickness and spacing remain schematic; this does not validate a particular device architecture.

入力と確認済みの内容
研究の概念
An exploded three-quarter cutaway of a conceptual planar perovskite solar cell. Show exactly six separate solid flat slabs, one slab per material, with equal gaps and no internal textures or additional sublayers.
含める対象
Glass substrate; transparent conducting electrode; electron transport layer; perovskite absorber; hole transport layer; metal electrode.
関係と矢印
Stack exactly six layers in the listed order, from glass at the bottom to metal at the top. Connect each label to the middle of its corresponding slab using a thin leader line without arrowheads. Layer thickness is schematic, not to scale.
正確なラベル · 任意
Glass; Transparent electrode; Electron transport layer; Perovskite absorber; Hole transport layer; Metal electrode
見た目の指定 · 任意
Minimal textbook diagram with ample whitespace and teal, blue and amber colors. Print ONLY the short labels explicitly listed in the content. No subtitles, paragraphs, footnotes or extra words. These are drawing directions, not text to display.
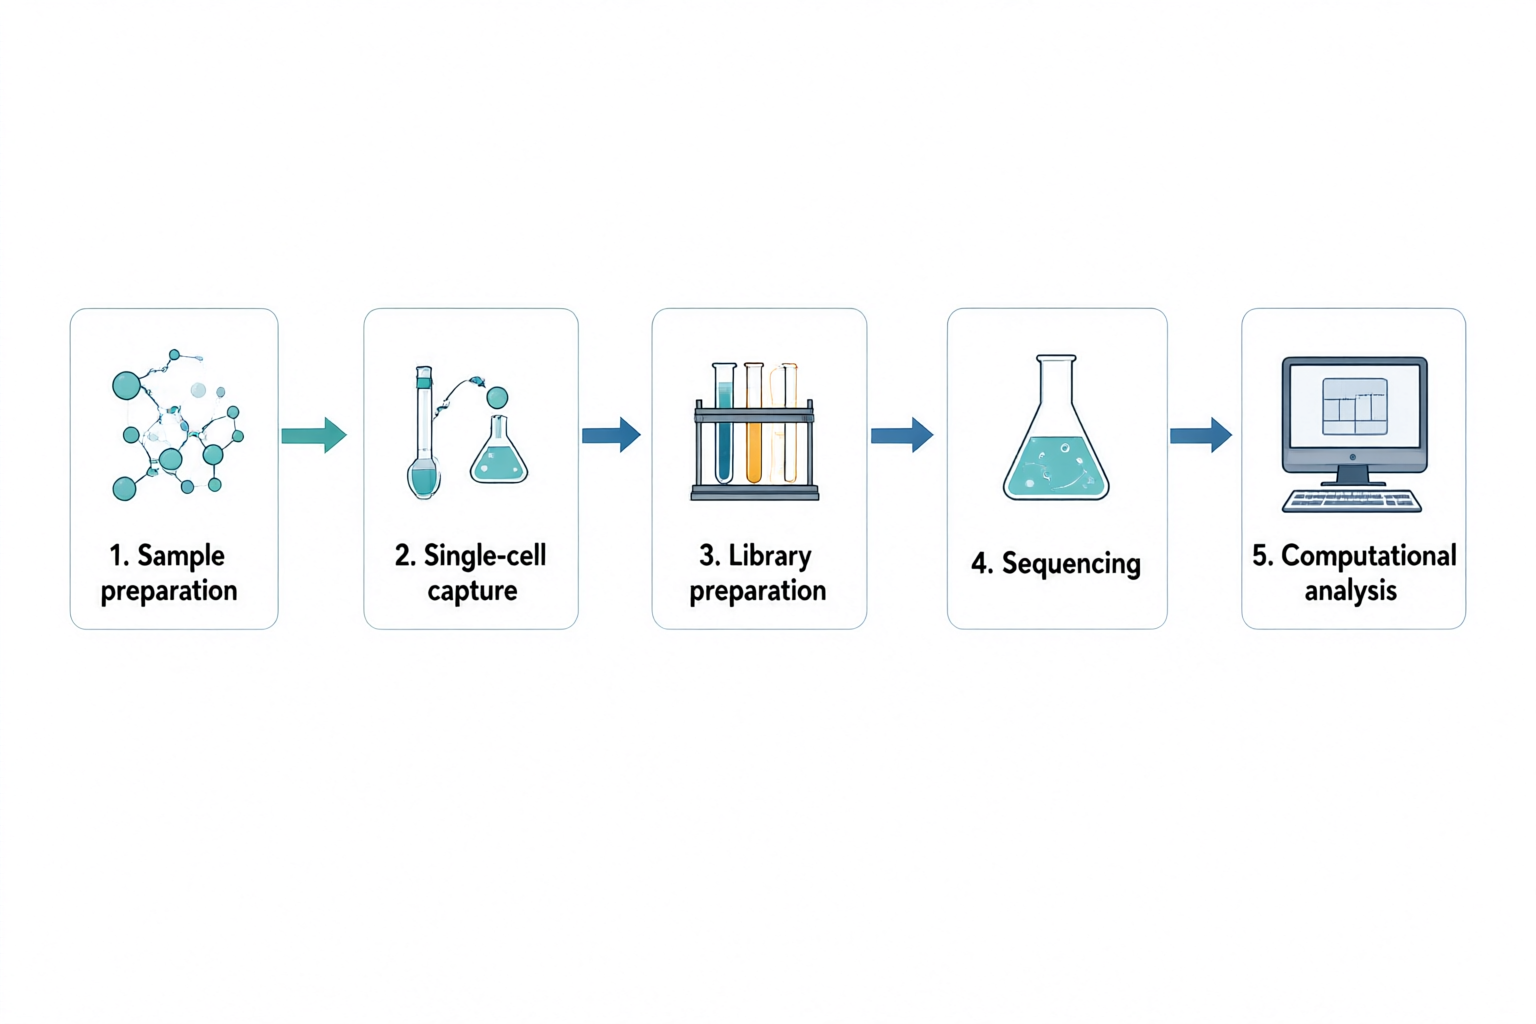
Five panels connected left to right: sample preparation, single-cell capture, library preparation, sequencing and computational analysis.
元の PNGqwen-image-3.0 · 1536 × 1024

科学イラスト

Single-cell RNA sequencing workflow

確認メモ

The five labels and four connecting arrows follow the requested left-to-right order. The sequencing stage uses a generic flask rather than a sequencing instrument. Replace that icon for a technical methods figure; this overview does not specify an assay protocol or show measured data.

入力と確認済みの内容
研究の概念
A high-level five-step workflow for single-cell RNA sequencing. Show a left-to-right sequence with numbered panels and one clear arrow between neighboring steps. Do not depict real sequencing measurements or an actual clustering result.
含める対象
Sample preparation; single-cell capture; library preparation; sequencing; computational analysis.
関係と矢印
Sample preparation leads to single-cell capture, then library preparation, sequencing and computational analysis. Use simple lab icons and a computer icon for the final stage. No branches or backward arrows.
正確なラベル · 任意
1. Sample preparation; 2. Single-cell capture; 3. Library preparation; 4. Sequencing; 5. Computational analysis
見た目の指定 · 任意
Minimal textbook diagram with ample whitespace and teal, blue and amber colors. Print ONLY the short labels explicitly listed in the content. No subtitles, paragraphs, footnotes or extra words. These are drawing directions, not text to display.
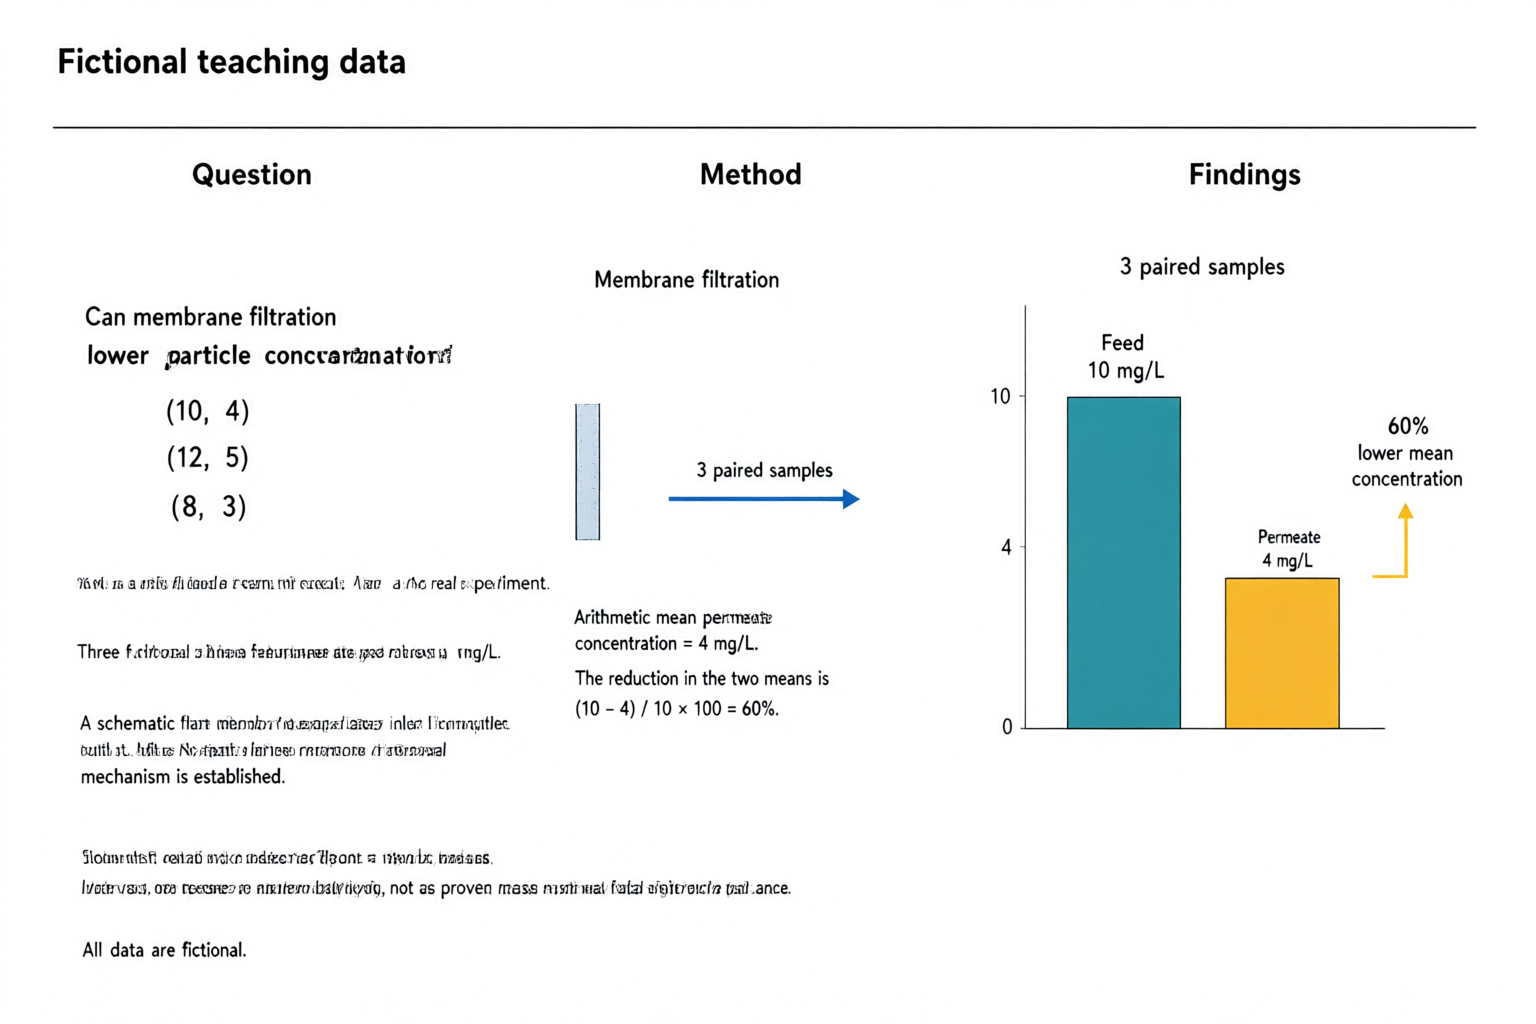
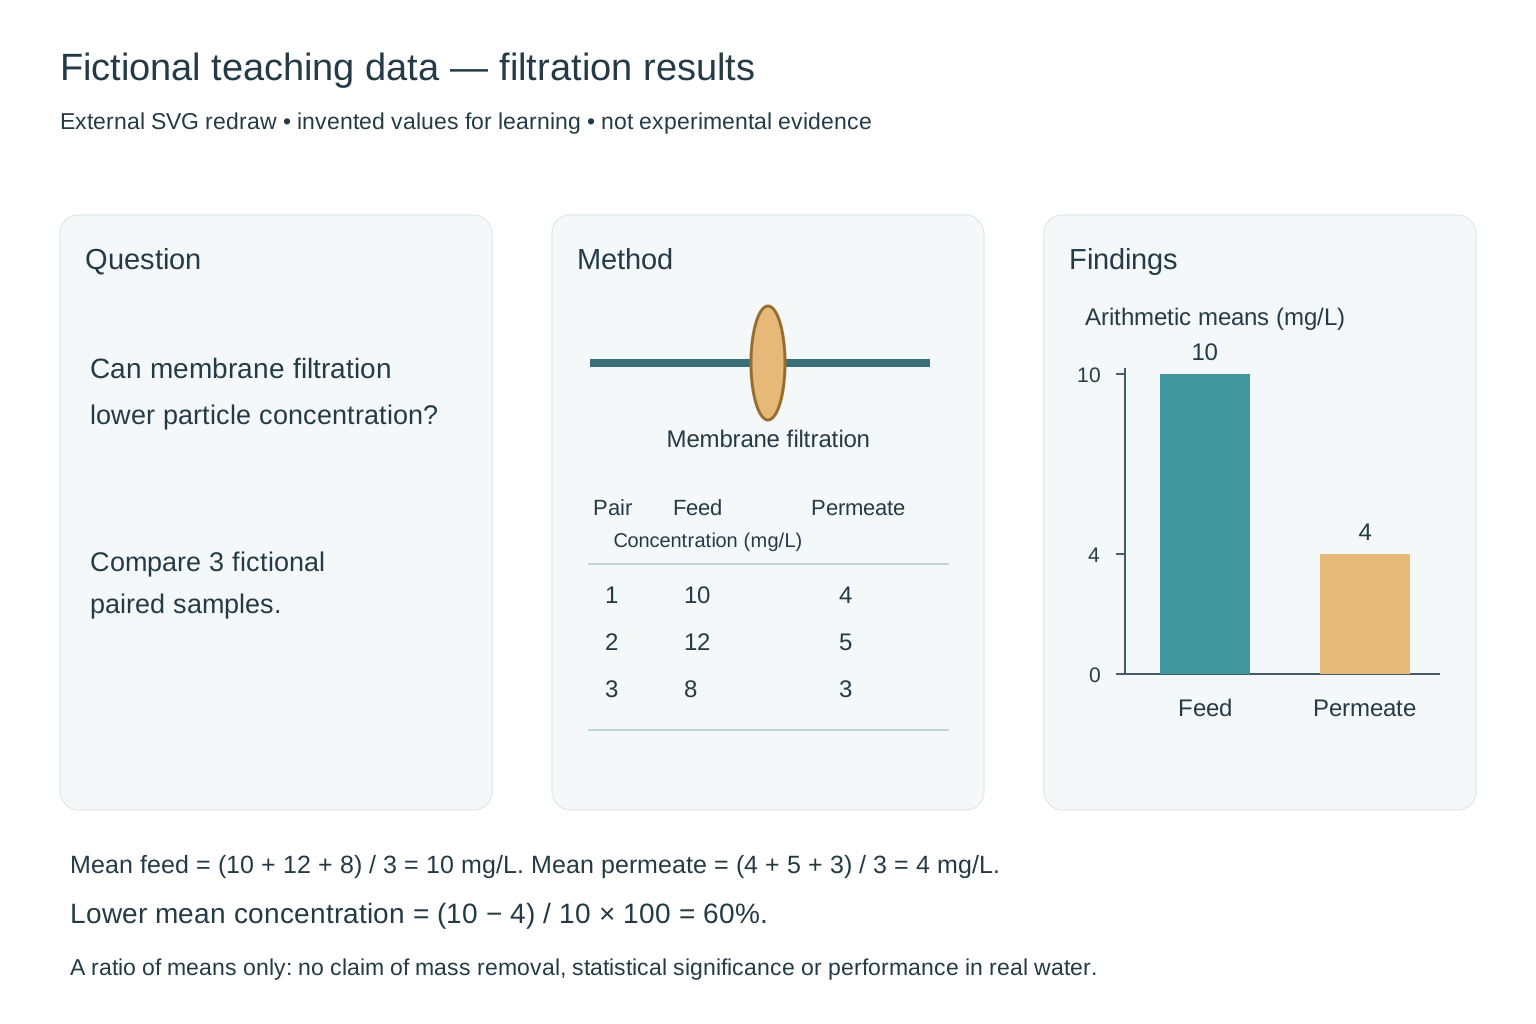
AI-generated fictional teaching abstract with question, filtration method and a zero-baseline chart showing feed at 10 mg/L and permeate at 4 mg/L, with a 60 percent lower mean.
元の PNGqwen-image-3.0 · 1536 × 1024

外部で描き直した参考図

External redraw of a fictional filtration abstract: three paired concentrations 10/4, 12/5 and 8/3 mg/L, arithmetic means 10 and 4, and a chart with a zero baseline and 60 percent lower mean concentration.
比較用に外部で描き直した SVG です。製品の直接出力や製品内の編集機能ではありません。科学的な確認は引き続き必要です。

グラフィカルアブストラクト

Filtration results — fictional teaching data

確認メモ

Fictional teaching data, not experimental evidence. The three feed/permeate pairs are (10, 4), (12, 5), (8, 3) mg/L. Their means are 10 and 4 mg/L, so (10 − 4) / 10 × 100 = 60% lower mean concentration. The original chart preserves these values and a zero baseline, but the extra small text is malformed and the membrane apparatus is incomplete. The 60% is a ratio of means, not proof of mass removal, a mean of individual percentages or statistical significance.

外部で描き直した参考図

Replaced malformed text with a clear question, a schematic membrane and the complete paired teaching dataset. Redrew the two bars on a shared zero baseline with heights in a 10:4 ratio. Both the figure and its caption identify the data as fictional; no error bars or significance claim are invented.

入力と確認済みの内容
研究課題
Can membrane filtration lower particle concentration? This is a fictional teaching example, not a real experiment.
方法
Three fictional paired feed/permeate concentrations in mg/L: (10, 4), (12, 5), (8, 3). A schematic flat membrane separates inlet from outlet. No statistical inference or removal mechanism is established.
主な知見
Arithmetic mean feed concentration = 10 mg/L; arithmetic mean permeate concentration = 4 mg/L. The reduction in the two means is (10 - 4) / 10 × 100 = 60%. Show this as lower mean concentration, not as proven mass removal or statistical significance. All data are fictional.
見た目の指定 · 任意
Minimal textbook diagram with ample whitespace and teal, blue and amber colors. Print ONLY the short labels explicitly listed in the content. No subtitles, paragraphs, footnotes or extra words. These are drawing directions, not text to display. Prominently label the whole figure "Fictional teaching data". Three panels: Question, Method, Findings. ONLY additional labels: "Membrane filtration", "3 paired samples", "Feed: 10 mg/L", "Permeate: 4 mg/L", "60% lower mean concentration". Use a simple two-bar chart with a zero baseline, feed bar height 10 and permeate bar height 4. No other numerical claims.
アイデアから始める

研究プロンプトを試す

これらはデモ用の入力です。生成結果やお客様の研究ではありません。

説明から下書きへ

確認工程のある科学イラスト作成

研究の概念を説明し、対象、関係、ラベルを明記します。モデルが画像を生成する前に詳細を確認してください。ダウンロード前には科学的な意味と描画された文字を確認します。

  1. 概念と対象を説明
  2. ラベルと関係を確認
  3. 生成し、科学的内容を確認してダウンロード

科学画像、イラスト、概念図

同じワークスペースで科学的な場面の画像や、手法と関係を説明するイラストを作成できます。矢印やグループを指定して概念図を構成することもできます。出力は PNG の草案で、ノードや接続線を直接編集する機能はありません。

説明を調整して、新しい版を生成

表現、レイアウトの指示、ラベルを変更して新しい画像を生成できます。この初期版はラスター PNG 画像を出力し、文字、ベクター、要素の直接編集はできません。再生成のたびに構図全体が変わる可能性があります。

グラフィカルアブストラクト

グラフィカルアブストラクトが必要ですか?

研究要約を分かりやすい視覚的なストーリーに。生成前に課題、方法、知見を確認します。

グラフィカルアブストラクトを作成

使用前に図版を確認

使用前にすべてのラベル、矢印、数値、科学的主張を確認してください。この画像は下書きであり、実験の証拠ではありません。

科学的な意味と文字を確認し、投稿先の AI、ライセンス、開示要件を確認してください。生成画像が自動的に正確になる、学術誌に承認される、実験の証拠に適するということはありません。

よくある質問

どのような科学図を作成できますか?

研究の概念、方法、関係を説明するイラストや、提供された研究を整理したグラフィカルアブストラクトを作成できます。データセットの作図や実験の証拠の生成は行いません。

実験データや実験画像を生成しますか?

説明用のイラストを作成するツールであり、測定データ、顕微鏡写真、スキャン画像、実験の証拠は生成しません。説明したい概念と関係だけを記述し、使用前にすべての科学的記述を確認してください。

文字やラベルを編集できますか?

説明とラベルの正確な文言を修正して別の画像を生成できます。この版ではピクセル、文字レイヤー、ベクター、個別要素の直接編集はできません。

対応する形式とサイズは?

1024 × 1024、1536 × 1024、1024 × 1536 ピクセルの PNG をダウンロードできます。SVG と PPTX の出力は提供していません。提供元の画像リンクは期限付きのため、速やかにダウンロードしてください。