FigureDraft

科研内容的视觉表达工作台

AI 科研配图生成器

用清晰的科研示意图解释你的研究。描述概念、确认细节,再生成可供审阅的配图草稿。

用于解释性示意配图,不生成实验数据证据。

01 / 描述你的配图

标签、图片尺寸与视觉要求

提取时会将摘要、生图时会将已确认的描述发送至所选服务商。请仅提交你有权向该服务商提供的研究内容。 当前处理服务商:Qianwen AI (maas.qianwenaiapi.com)。隐私政策

每张成功生成的图片消耗 1 积分,重新生成同样计费。失败释放预留积分,PNG 下载不额外扣费。

精选科研配图案例

原始 PNG 由 FigureDraft 根据英文演示输入实际生成,外部重绘图另行标注。检查说明记录可见问题与限制;所有案例仍需独立的科学审核。

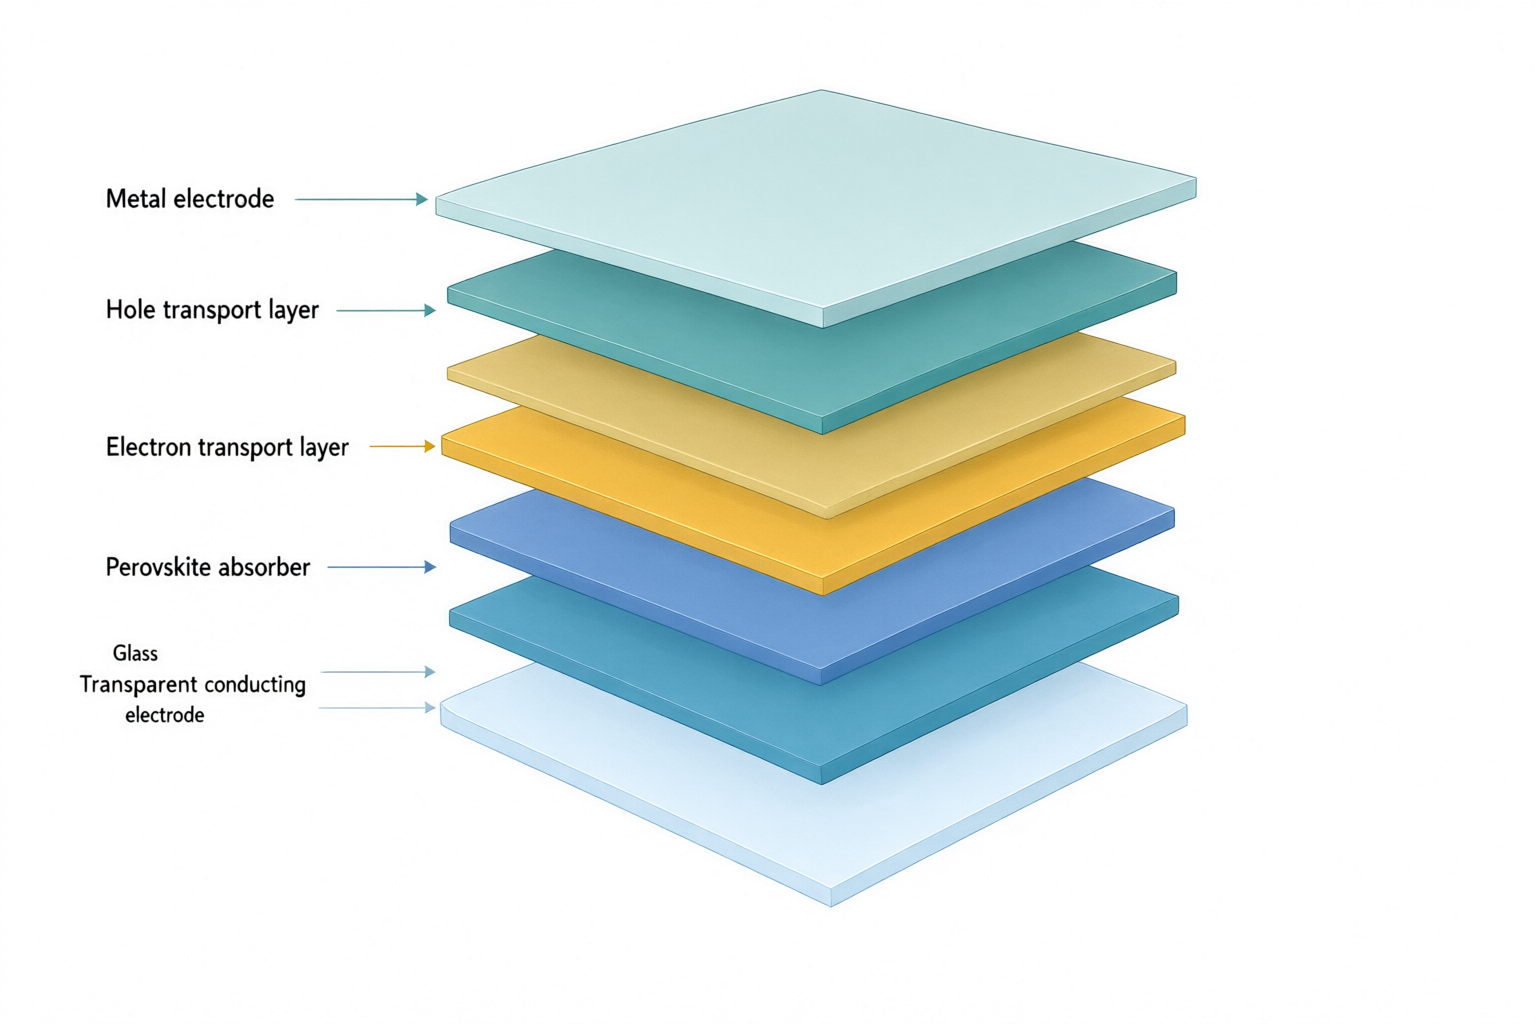
Exploded solar cell stack with labels for glass, transparent electrode, electron transport, perovskite, hole transport and metal.
原始 PNGqwen-image-3.0 · 1536 × 1024

外部重绘参考图

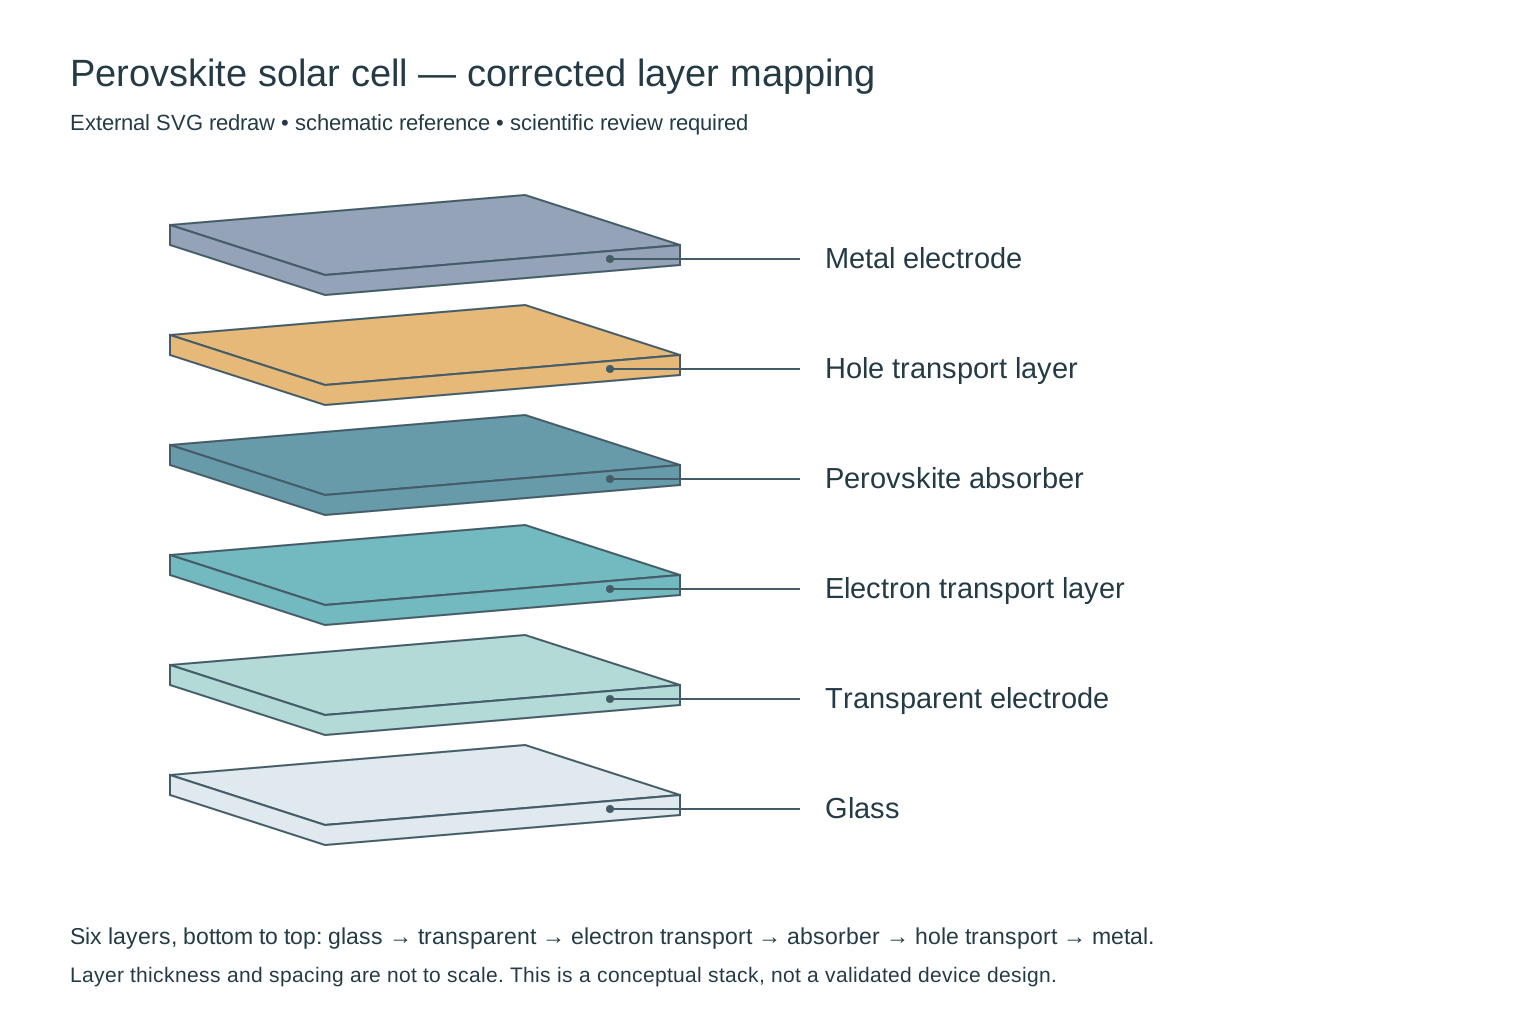
External redraw of exactly six solar-cell layers, from glass at the bottom to metal at the top, with each label connected to its own layer.
用于对照的外部 SVG 重绘,不是产品直接输出,也不代表产品提供图像编辑功能。仍需科学审核。

科研图片

Perovskite solar cell layers

检查说明

Needs correction: the output adds a seventh slab and does not preserve the requested layer-to-label mapping. In particular, check the electron-transport/perovskite order and the two bottom labels. This is a composition draft, not a validated device architecture; thickness is not to scale.

外部重绘参考图

Removed the extra slab, restored the requested six-layer sequence and attached each leader to its matching layer. Thickness and spacing remain schematic; this does not validate a particular device architecture.

输入与确认内容
研究概念
An exploded three-quarter cutaway of a conceptual planar perovskite solar cell. Show exactly six separate solid flat slabs, one slab per material, with equal gaps and no internal textures or additional sublayers.
必须出现的对象
Glass substrate; transparent conducting electrode; electron transport layer; perovskite absorber; hole transport layer; metal electrode.
对象关系与箭头
Stack exactly six layers in the listed order, from glass at the bottom to metal at the top. Connect each label to the middle of its corresponding slab using a thin leader line without arrowheads. Layer thickness is schematic, not to scale.
准确标签 · 选填
Glass; Transparent electrode; Electron transport layer; Perovskite absorber; Hole transport layer; Metal electrode
视觉要求 · 选填
Minimal textbook diagram with ample whitespace and teal, blue and amber colors. Print ONLY the short labels explicitly listed in the content. No subtitles, paragraphs, footnotes or extra words. These are drawing directions, not text to display.
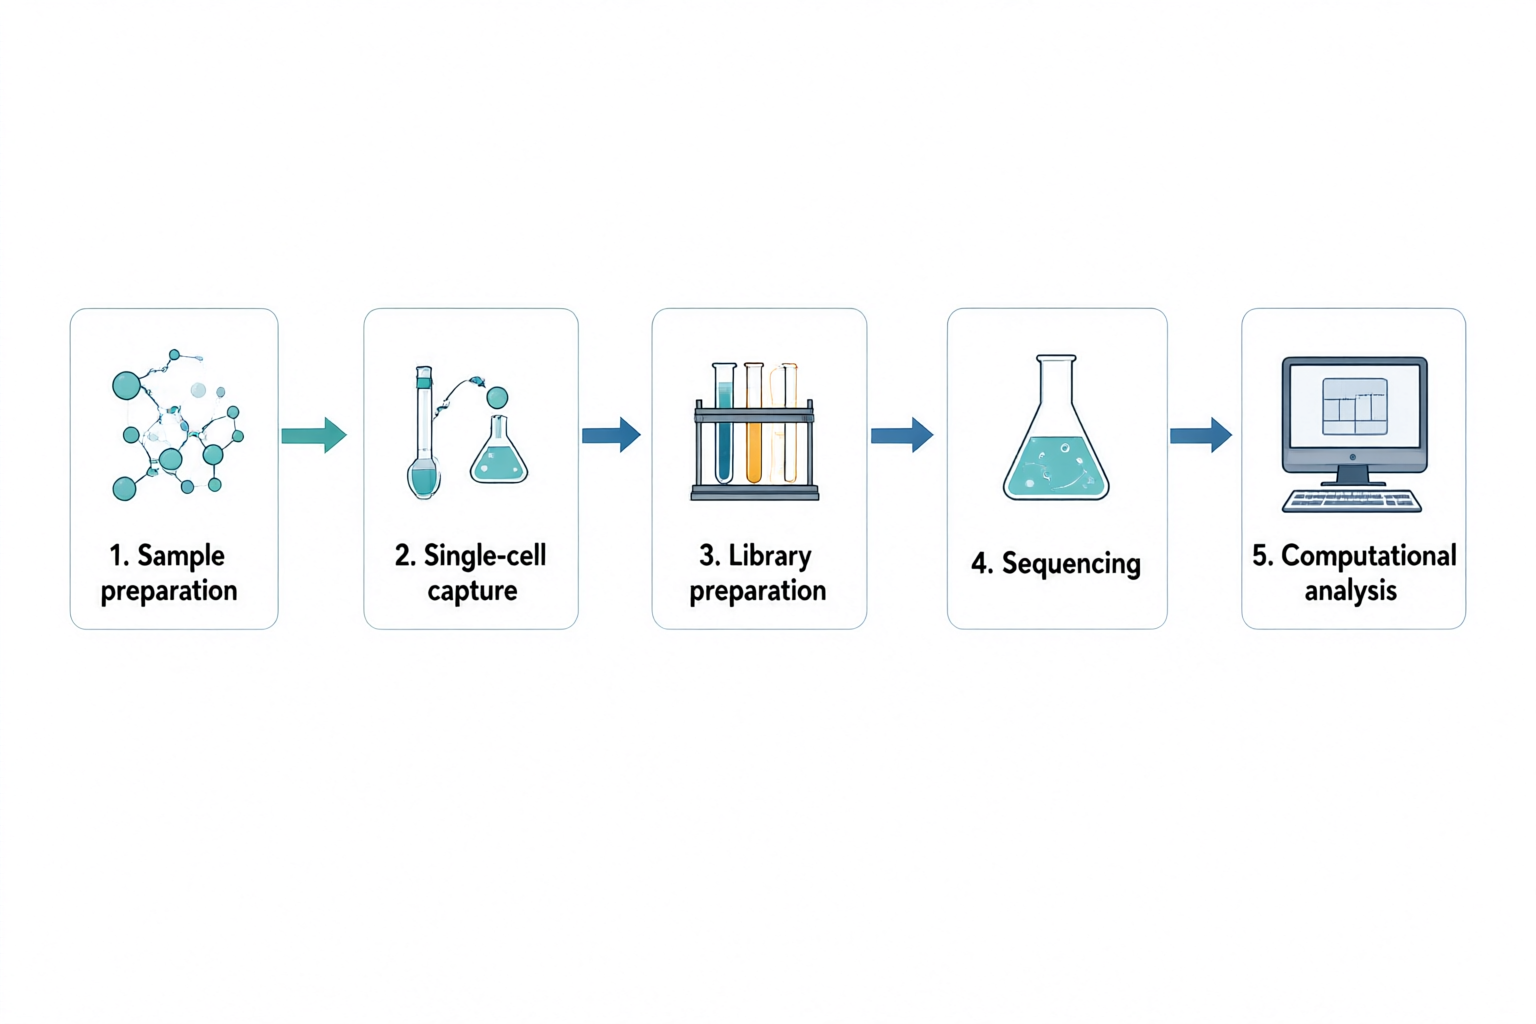
Five panels connected left to right: sample preparation, single-cell capture, library preparation, sequencing and computational analysis.
原始 PNGqwen-image-3.0 · 1536 × 1024

科研插图

Single-cell RNA sequencing workflow

检查说明

The five labels and four connecting arrows follow the requested left-to-right order. The sequencing stage uses a generic flask rather than a sequencing instrument. Replace that icon for a technical methods figure; this overview does not specify an assay protocol or show measured data.

输入与确认内容
研究概念
A high-level five-step workflow for single-cell RNA sequencing. Show a left-to-right sequence with numbered panels and one clear arrow between neighboring steps. Do not depict real sequencing measurements or an actual clustering result.
必须出现的对象
Sample preparation; single-cell capture; library preparation; sequencing; computational analysis.
对象关系与箭头
Sample preparation leads to single-cell capture, then library preparation, sequencing and computational analysis. Use simple lab icons and a computer icon for the final stage. No branches or backward arrows.
准确标签 · 选填
1. Sample preparation; 2. Single-cell capture; 3. Library preparation; 4. Sequencing; 5. Computational analysis
视觉要求 · 选填
Minimal textbook diagram with ample whitespace and teal, blue and amber colors. Print ONLY the short labels explicitly listed in the content. No subtitles, paragraphs, footnotes or extra words. These are drawing directions, not text to display.
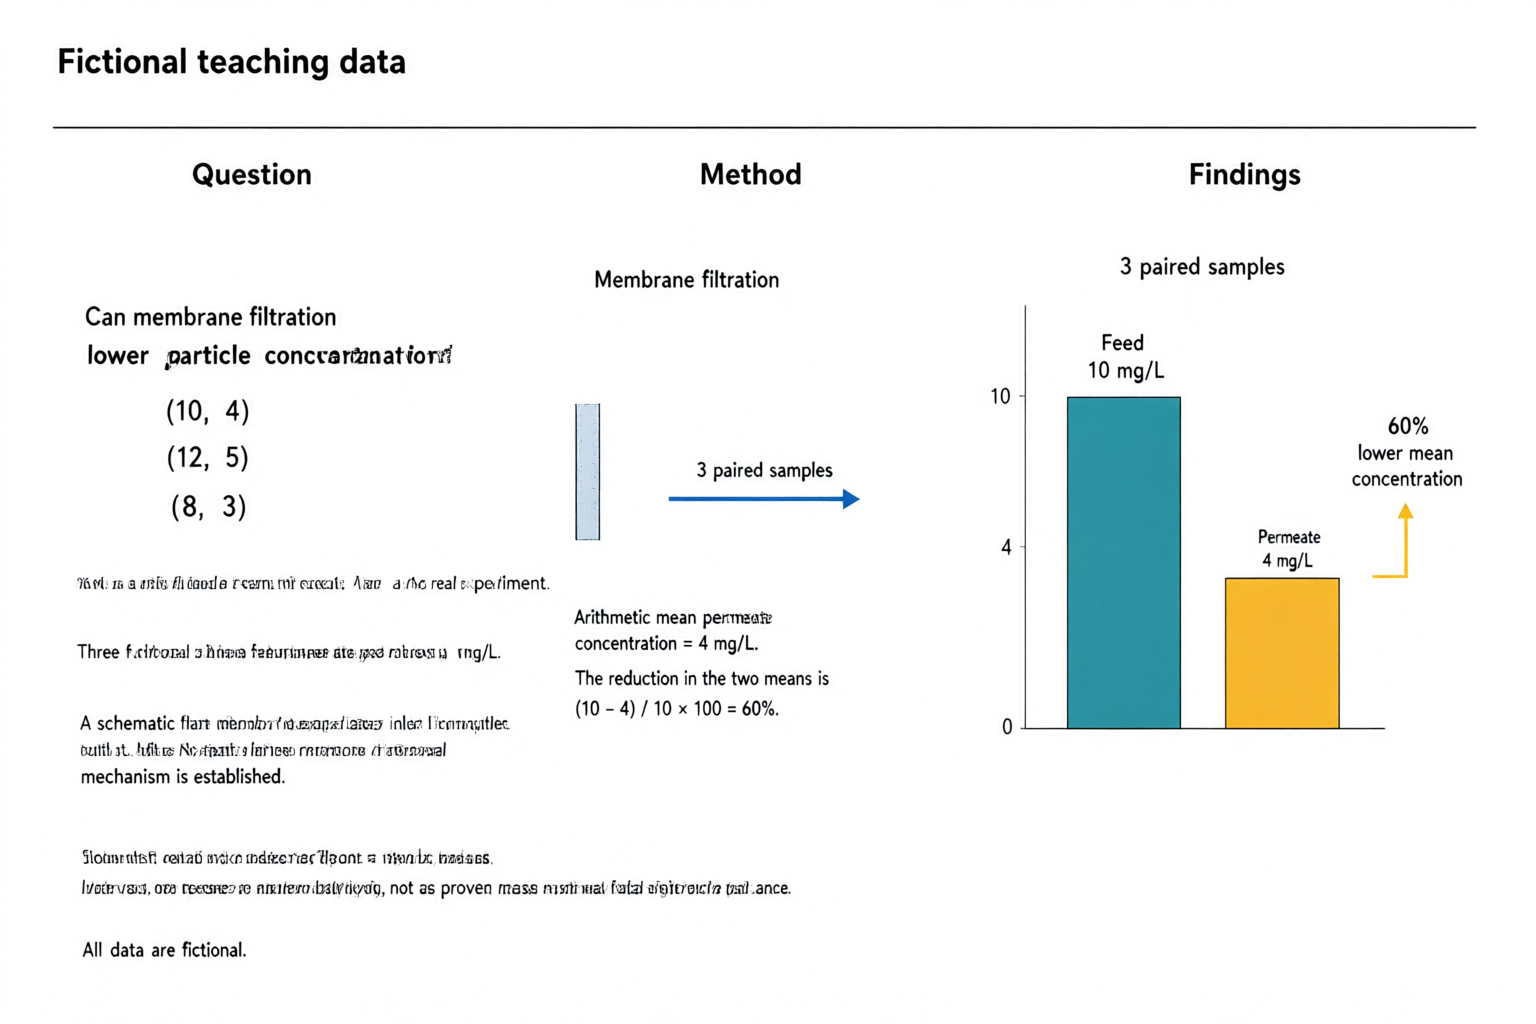
AI-generated fictional teaching abstract with question, filtration method and a zero-baseline chart showing feed at 10 mg/L and permeate at 4 mg/L, with a 60 percent lower mean.
原始 PNGqwen-image-3.0 · 1536 × 1024

外部重绘参考图

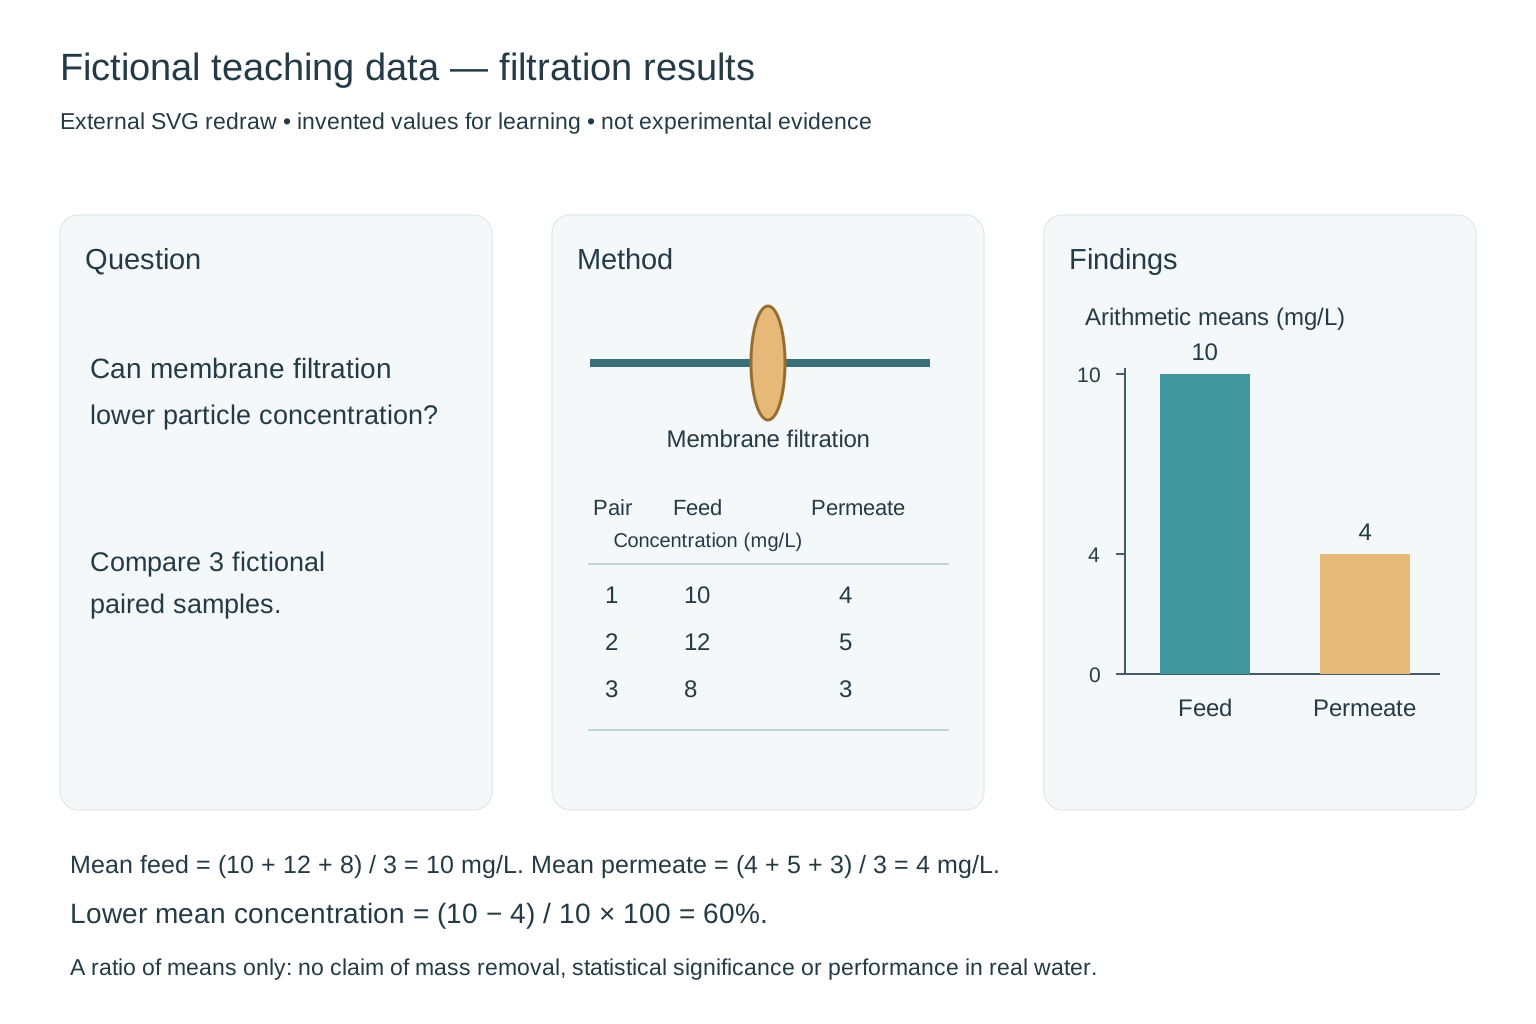
External redraw of a fictional filtration abstract: three paired concentrations 10/4, 12/5 and 8/3 mg/L, arithmetic means 10 and 4, and a chart with a zero baseline and 60 percent lower mean concentration.
用于对照的外部 SVG 重绘,不是产品直接输出,也不代表产品提供图像编辑功能。仍需科学审核。

图形摘要

Filtration results — fictional teaching data

检查说明

Fictional teaching data, not experimental evidence. The three feed/permeate pairs are (10, 4), (12, 5), (8, 3) mg/L. Their means are 10 and 4 mg/L, so (10 − 4) / 10 × 100 = 60% lower mean concentration. The original chart preserves these values and a zero baseline, but the extra small text is malformed and the membrane apparatus is incomplete. The 60% is a ratio of means, not proof of mass removal, a mean of individual percentages or statistical significance.

外部重绘参考图

Replaced malformed text with a clear question, a schematic membrane and the complete paired teaching dataset. Redrew the two bars on a shared zero baseline with heights in a 10:4 ratio. Both the figure and its caption identify the data as fictional; no error bars or significance claim are invented.

输入与确认内容
研究问题
Can membrane filtration lower particle concentration? This is a fictional teaching example, not a real experiment.
研究方法
Three fictional paired feed/permeate concentrations in mg/L: (10, 4), (12, 5), (8, 3). A schematic flat membrane separates inlet from outlet. No statistical inference or removal mechanism is established.
主要发现
Arithmetic mean feed concentration = 10 mg/L; arithmetic mean permeate concentration = 4 mg/L. The reduction in the two means is (10 - 4) / 10 × 100 = 60%. Show this as lower mean concentration, not as proven mass removal or statistical significance. All data are fictional.
视觉要求 · 选填
Minimal textbook diagram with ample whitespace and teal, blue and amber colors. Print ONLY the short labels explicitly listed in the content. No subtitles, paragraphs, footnotes or extra words. These are drawing directions, not text to display. Prominently label the whole figure "Fictional teaching data". Three panels: Question, Method, Findings. ONLY additional labels: "Membrane filtration", "3 paired samples", "Feed: 10 mg/L", "Permeate: 4 mg/L", "60% lower mean concentration". Use a simple two-bar chart with a zero baseline, feed bar height 10 and permeate bar height 4. No other numerical claims.
从一个研究概念开始

科研配图示例:从描述开始

以下为演示输入,不是已生成的图片或真实客户研究。

从描述到配图草稿

从研究描述到科研插图

描述研究概念,写清对象、关系和标签。确认这些内容后再交给模型生成。下载前,审阅图中的科学含义和文字。

  1. 描述研究概念与对象
  2. 确认标签和对象关系
  3. 生成、审阅科学含义并下载

科研图片、解释性插图与概念示意图

在同一个工作台中生成科学场景图片,或解释研究方法与对象关系的科研插图。描述箭头方向和对象分组,也可以组织概念示意图。输出为 PNG 草稿,不提供节点或连接线的直接编辑。

调整标签、布局与对象关系

调整描述、布局要求或标签后,重新生成整张图片。首版输出 PNG 位图,不支持直接编辑文字、矢量或单个元素。重新生成可能改变整体构图。

图形摘要

需要将论文整理为图形摘要?

将研究总结组织成清晰的视觉表达。先审阅研究问题、方法与主要发现,再生成图形摘要。

制作图形摘要

使用前,审阅你的科研配图

使用前请核对每个标签、箭头、数字和科学表述。这是示意草稿,不是实验数据证据。

请核对科学含义与文字,并检查目标期刊的 AI、许可和披露要求。生成结果不代表天然准确、已获期刊认可或可作为实验数据证据。

常见问题

可以生成哪些科研配图?

可以表达研究概念、方法和对象关系,也可以把已有研究内容组织成图形摘要。本站不绘制数值数据图表,不生成实验数据证据。

工具会生成实验数据或实验影像吗?

工具生成解释性插图,不生成测量数据、显微照片、扫描影像或实验数据证据。请只描述需要解释的概念和关系,并在使用前核对每一项科学表述。

可以编辑文字和标签吗?

可以修改描述和准确标签后重新生成。目前不提供像素、文字图层、矢量或单个元素的直接编辑。

支持哪些导出格式和尺寸?

支持 1024 × 1024、1536 × 1024 和 1024 × 1536 像素的 PNG 下载,暂不提供 SVG 或 PPTX。服务商图片链接会过期,请及时下载。