FigureDraft

科研内容的视觉表达工作台

AI 图形摘要生成器

将研究总结组织成清晰的视觉表达。先审阅研究问题、方法与主要发现,再生成图形摘要。

用于解释性示意配图,不生成实验数据证据。

01 / 整理研究内容

文本模型从摘要中摘录原文;未提供的信息留空,等待你补充。首版无需上传 PDF。

提取时会将摘要、生图时会将已确认的描述发送至所选服务商。请仅提交你有权向该服务商提供的研究内容。 当前处理服务商:Qianwen AI (maas.qianwenaiapi.com)。隐私政策

每张成功生成的图片消耗 1 积分,重新生成同样计费。失败释放预留积分,PNG 下载不额外扣费。

图形摘要生成案例

原始 PNG 由 FigureDraft 根据英文演示输入实际生成,外部重绘图另行标注。检查说明记录可见问题与限制;所有案例仍需独立的科学审核。

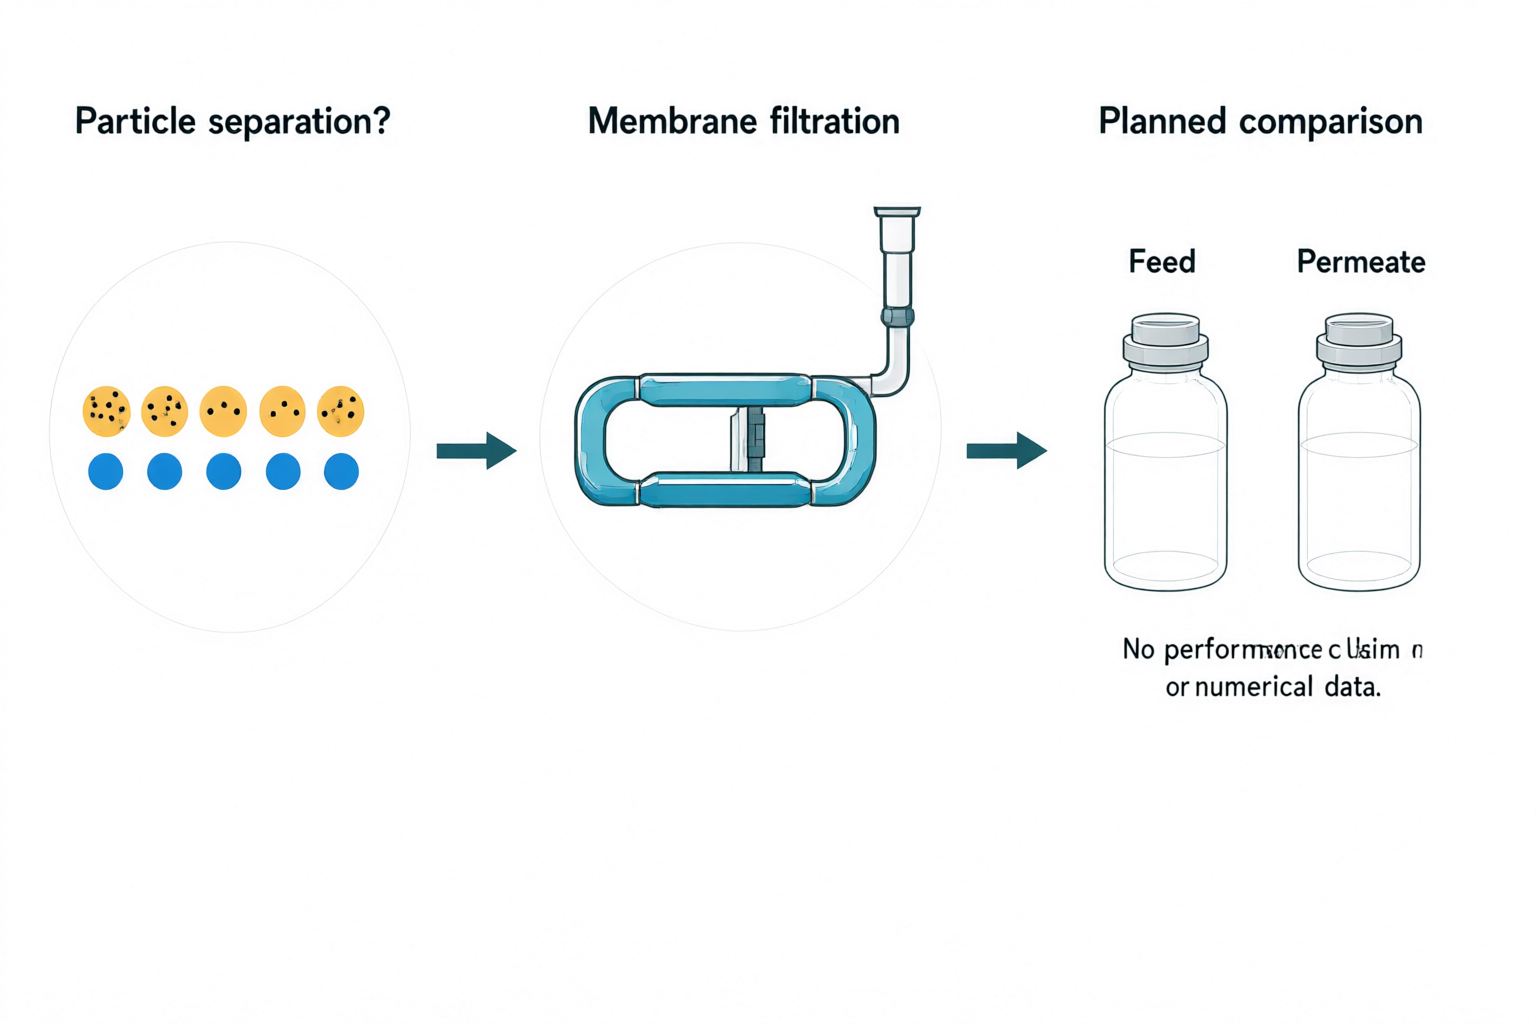
Membrane filtration study design showing a particle-separation question, filtration apparatus and a planned feed-versus-permeate comparison.
原始 PNGqwen-image-3.0 · 1536 × 1024

外部重绘参考图

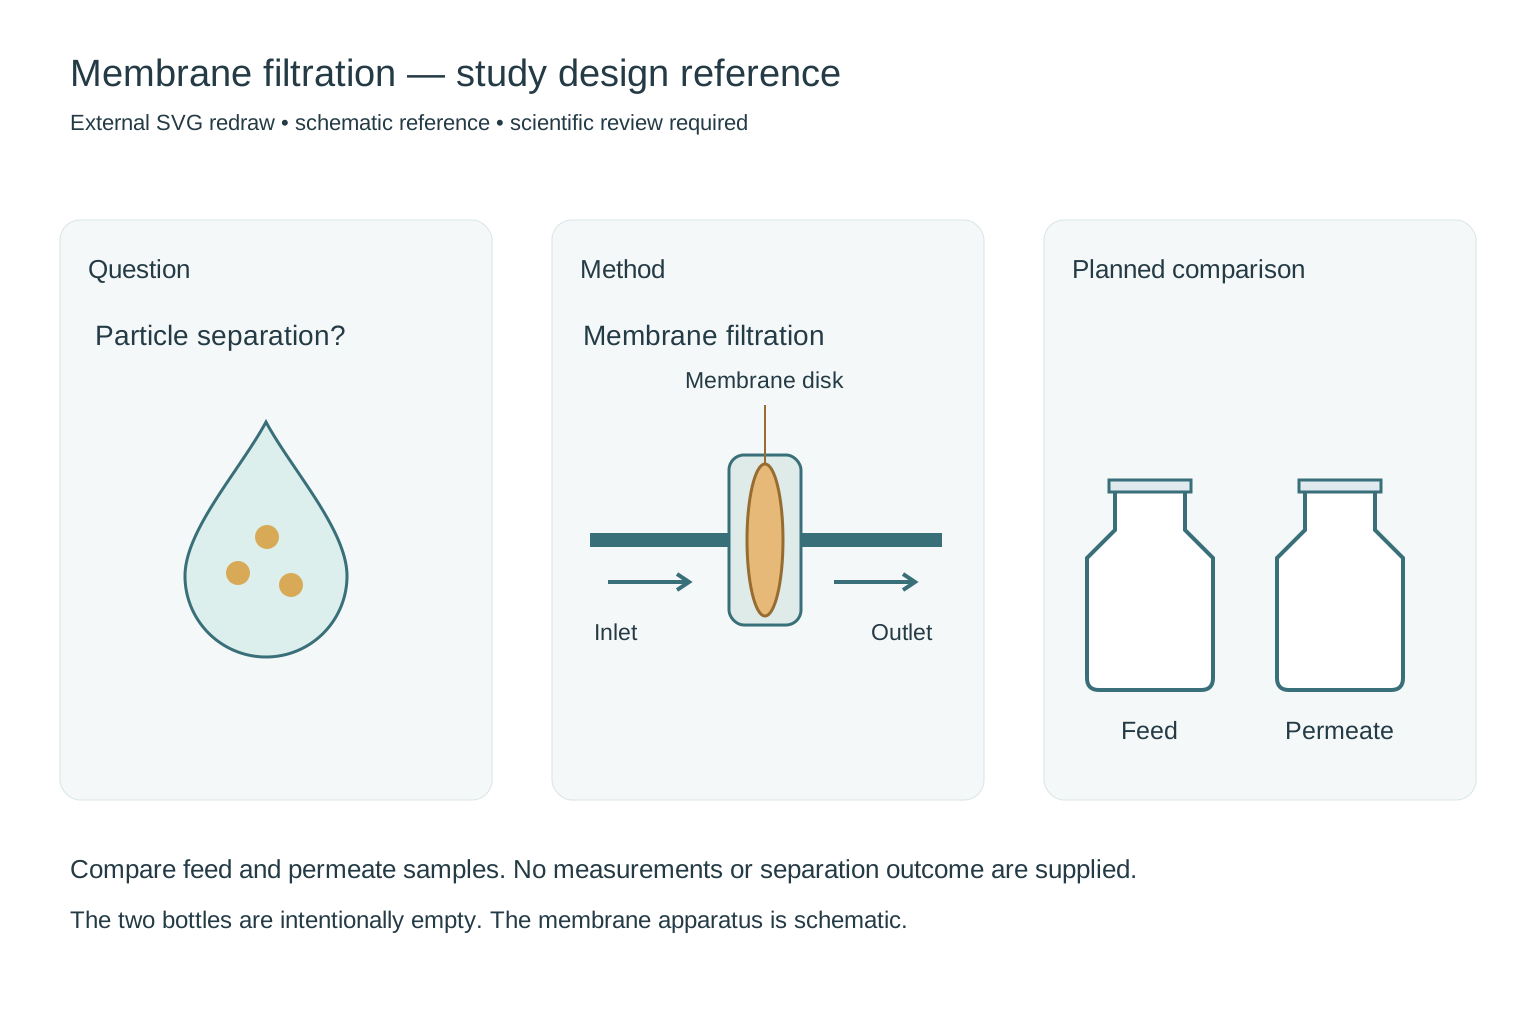
External redraw showing a clearly labeled membrane disk between inlet and outlet, followed by identical empty Feed and Permeate bottles.
用于对照的外部 SVG 重绘,不是产品直接输出,也不代表产品提供图像编辑功能。仍需科学审核。

图形摘要

Membrane filtration study design

检查说明

The three panels and matching Feed/Permeate bottles communicate a planned comparison. Needs correction: the apparatus does not clearly identify the requested membrane disk and extra text below the bottles is malformed. Redraw the setup and remove the extra text before use. No separation result was supplied.

外部重绘参考图

Redrew and labeled the membrane disk, inlet and outlet. Replaced malformed text with readable labels and kept both comparison bottles empty. This remains a study design without findings.

输入与确认内容
研究问题
Particle separation? A water droplet containing three small particle symbols.
研究方法
Membrane filtration: a flat membrane disk between an inlet and an outlet tube, shown as a schematic apparatus.
主要发现
Planned comparison, with no results yet: two identical empty outline sample bottles labeled Feed and Permeate. Keep both bottles unfilled and identical. No performance claim or numerical data.
视觉要求 · 选填
Minimal textbook diagram with ample whitespace and teal, blue and amber colors. Print ONLY the short labels explicitly listed in the content. No subtitles, paragraphs, footnotes or extra words. These are drawing directions, not text to display. The ONLY visible text is: "Particle separation?", "Membrane filtration", "Planned comparison", "Feed", "Permeate". Use flat vector-style icons in three horizontal panels.
原始 PNG
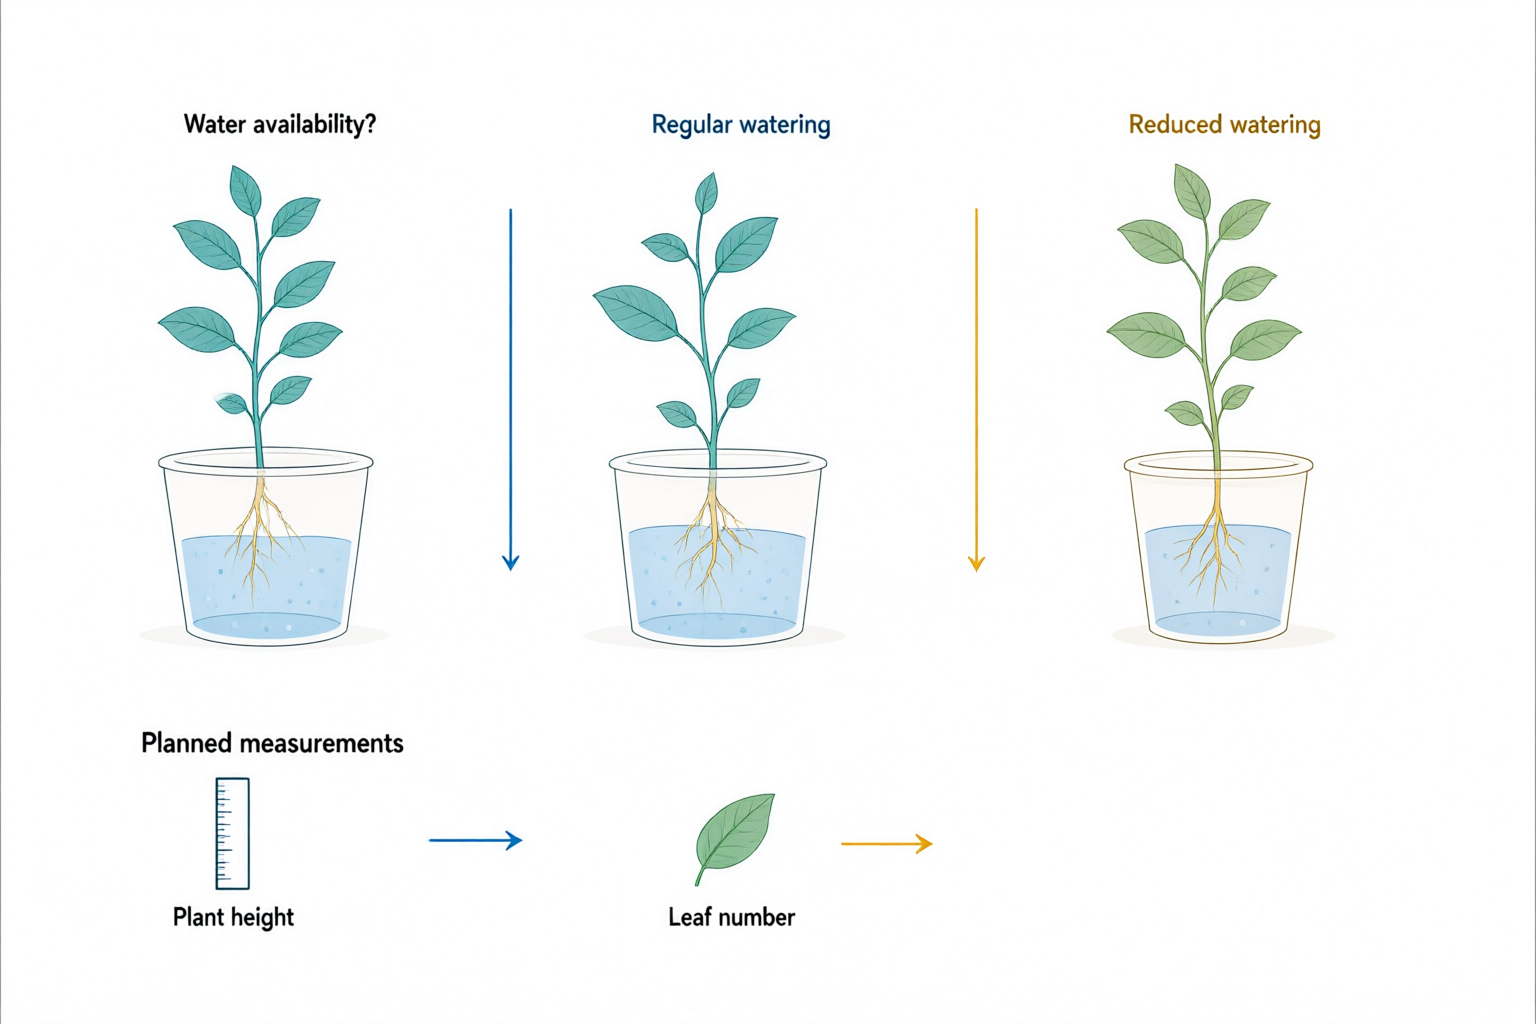
Three schematic plants under water-availability and watering labels, with a ruler and leaf representing planned measurements.
原始 PNGqwen-image-3.0 · 1536 × 1024

外部重绘参考图

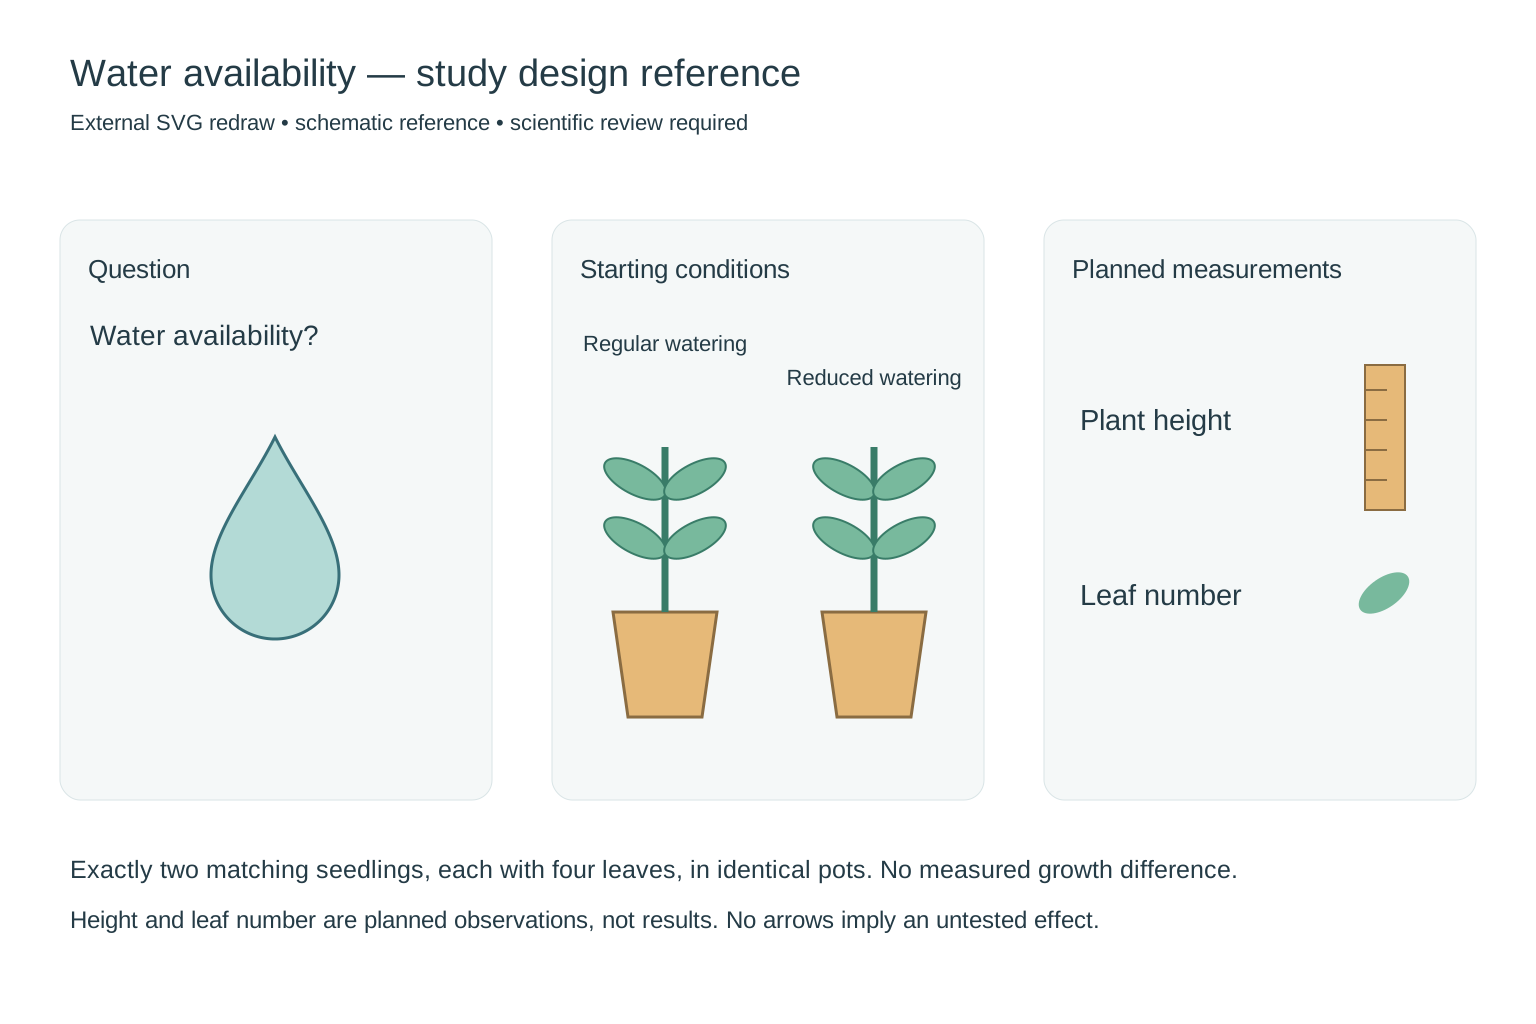
External redraw of two identical four-leaf seedlings in matching pots under regular and reduced watering, with planned height and leaf-count observations.
用于对照的外部 SVG 重绘,不是产品直接输出,也不代表产品提供图像编辑功能。仍需科学审核。

图形摘要

Plant water-stress study design

检查说明

The planned measurement labels are readable and no numerical results are shown. Needs correction: the output uses three plants and more than four leaves per seedling, rather than the requested two matching four-leaf seedlings in pots. Extra arrows near the measurement icons have no defined meaning. These are not observed growth differences.

外部重绘参考图

Reduced the setup to exactly two matching four-leaf seedlings, removed unexplained arrows and separated starting conditions from planned observations. No growth response or treatment result is claimed.

输入与确认内容
研究问题
Water availability? A water droplet beside a leaf.
研究方法
Two identical healthy seedlings, each with four leaves and the same height in matching pots. Label one Regular watering and the other Reduced watering. They represent the starting conditions of a proposed experiment.
主要发现
Planned measurements, with no findings yet: a ruler icon labeled Plant height and a leaf icon labeled Leaf number. No numbers, graphs or different plant sizes.
视觉要求 · 选填
Minimal textbook diagram with ample whitespace and teal, blue and amber colors. Print ONLY the short labels explicitly listed in the content. No subtitles, paragraphs, footnotes or extra words. These are drawing directions, not text to display. The ONLY visible text is: "Water availability?", "Regular watering", "Reduced watering", "Planned measurements", "Plant height", "Leaf number". Use flat vector-style icons in three horizontal panels.
原始 PNG
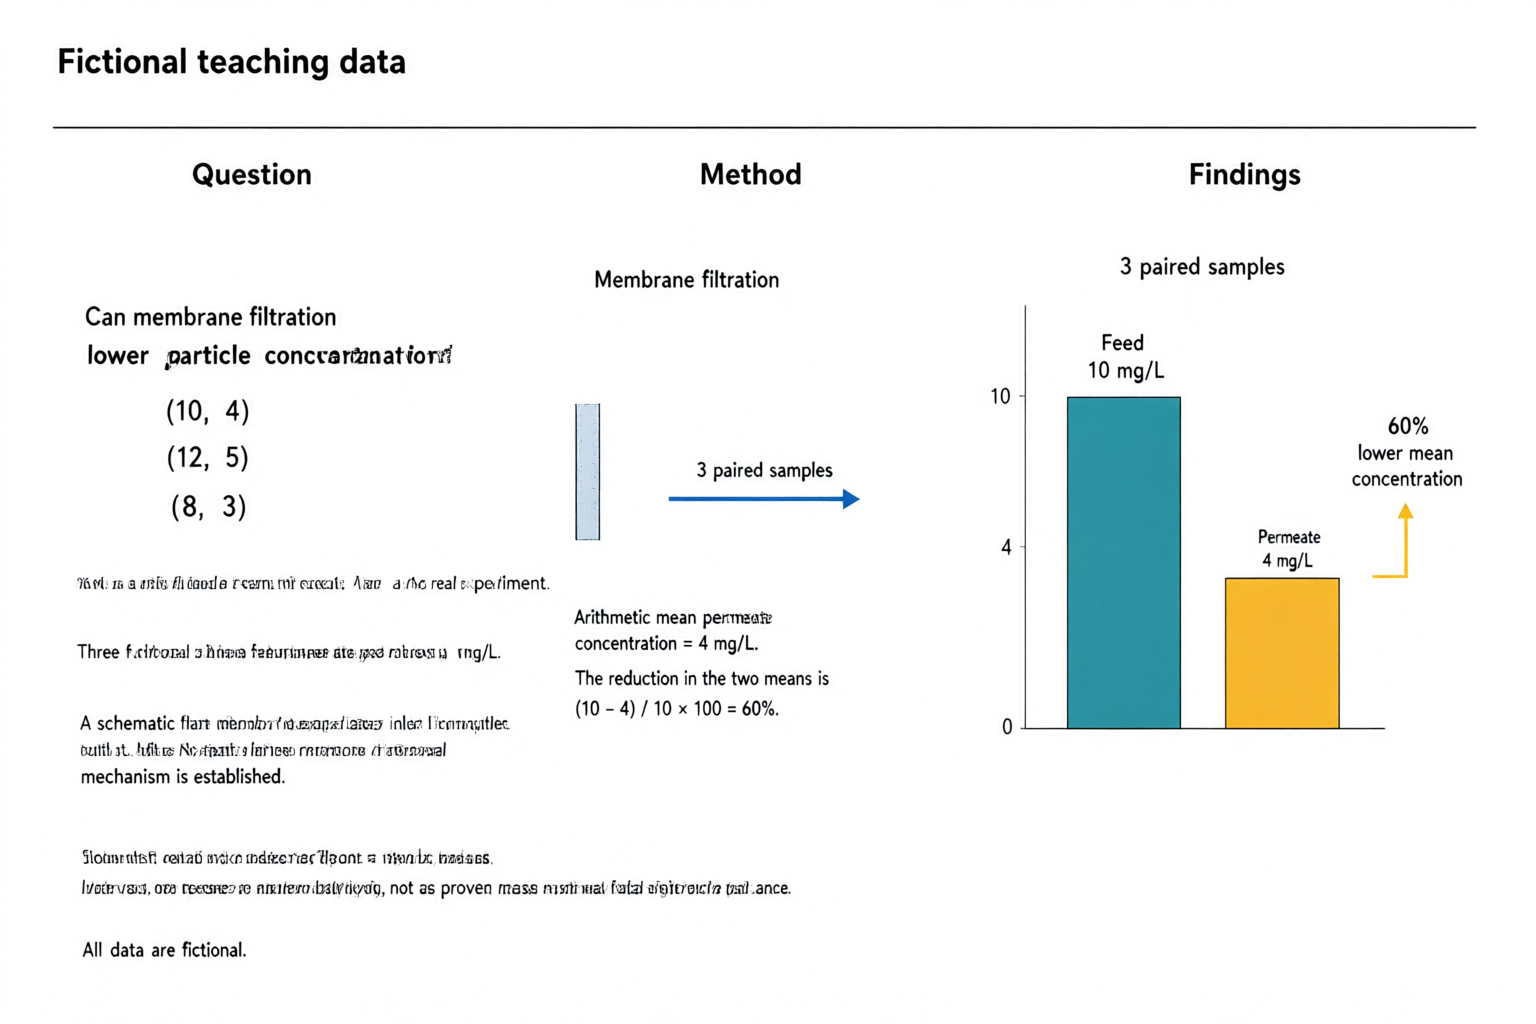
AI-generated fictional teaching abstract with question, filtration method and a zero-baseline chart showing feed at 10 mg/L and permeate at 4 mg/L, with a 60 percent lower mean.
原始 PNGqwen-image-3.0 · 1536 × 1024

外部重绘参考图

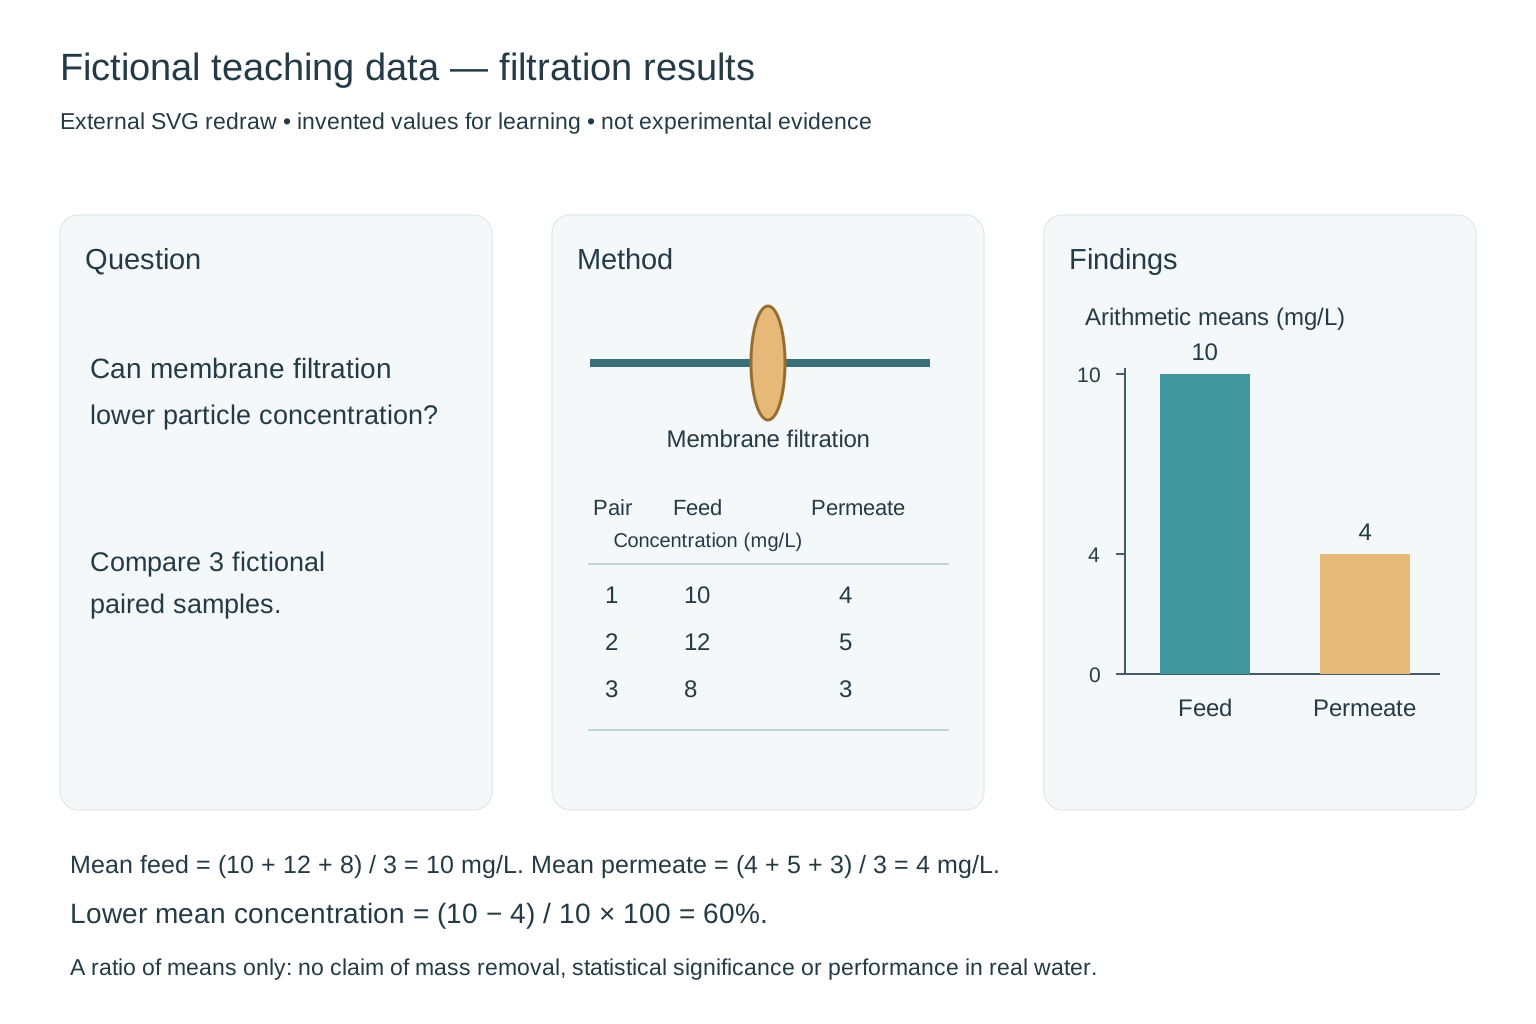
External redraw of a fictional filtration abstract: three paired concentrations 10/4, 12/5 and 8/3 mg/L, arithmetic means 10 and 4, and a chart with a zero baseline and 60 percent lower mean concentration.
用于对照的外部 SVG 重绘,不是产品直接输出,也不代表产品提供图像编辑功能。仍需科学审核。

图形摘要

Filtration results — fictional teaching data

检查说明

Fictional teaching data, not experimental evidence. The three feed/permeate pairs are (10, 4), (12, 5), (8, 3) mg/L. Their means are 10 and 4 mg/L, so (10 − 4) / 10 × 100 = 60% lower mean concentration. The original chart preserves these values and a zero baseline, but the extra small text is malformed and the membrane apparatus is incomplete. The 60% is a ratio of means, not proof of mass removal, a mean of individual percentages or statistical significance.

外部重绘参考图

Replaced malformed text with a clear question, a schematic membrane and the complete paired teaching dataset. Redrew the two bars on a shared zero baseline with heights in a 10:4 ratio. Both the figure and its caption identify the data as fictional; no error bars or significance claim are invented.

输入与确认内容
研究问题
Can membrane filtration lower particle concentration? This is a fictional teaching example, not a real experiment.
研究方法
Three fictional paired feed/permeate concentrations in mg/L: (10, 4), (12, 5), (8, 3). A schematic flat membrane separates inlet from outlet. No statistical inference or removal mechanism is established.
主要发现
Arithmetic mean feed concentration = 10 mg/L; arithmetic mean permeate concentration = 4 mg/L. The reduction in the two means is (10 - 4) / 10 × 100 = 60%. Show this as lower mean concentration, not as proven mass removal or statistical significance. All data are fictional.
视觉要求 · 选填
Minimal textbook diagram with ample whitespace and teal, blue and amber colors. Print ONLY the short labels explicitly listed in the content. No subtitles, paragraphs, footnotes or extra words. These are drawing directions, not text to display. Prominently label the whole figure "Fictional teaching data". Three panels: Question, Method, Findings. ONLY additional labels: "Membrane filtration", "3 paired samples", "Feed: 10 mg/L", "Permeate: 4 mg/L", "60% lower mean concentration". Use a simple two-bar chart with a zero baseline, feed bar height 10 and permeate bar height 4. No other numerical claims.
原始 PNG

从一个研究概念开始

图形摘要示例:试用研究总结

以下为演示输入,不是已生成的图片或真实客户研究。

从描述到配图草稿

如何制作图形摘要

粘贴摘要,提取原文片段,核对研究问题、方法和发现。补充缺失内容并选择布局,确认后再生成。图形摘要生成器仅依据你确认的要点组织图片。

  1. 粘贴论文摘要或研究总结
  2. 审阅提取的问题、方法与发现
  3. 生成、审阅科学含义并下载

导出前,核对科学内容

使用前请核对每个标签、箭头、数字和科学表述。这是示意草稿,不是实验数据证据。

逐项核对摘录,保留数字、单位和比较方向。请根据自己的研究补充缺失信息后继续。

请核对科学含义与文字,并检查目标期刊的 AI、许可和披露要求。生成结果不代表天然准确、已获期刊认可或可作为实验数据证据。

调整描述、布局要求或标签后,重新生成整张图片。首版输出 PNG 位图,不支持直接编辑文字、矢量或单个元素。重新生成可能改变整体构图。

需要单独的科研插图?试用科研配图生成器 →

常见问题

研究总结应该包含哪些信息?

请包含研究问题、方法和实际发现,保留需要表达的数字、单位和比较关系。缺失的信息需要你自行补充,工具不会为了补全摘要而编造发现。

可以修改提取的研究要点吗?

可以。模型选择原文片段供你审阅,你可以对照研究修改各字段、选择信息组织方式,确认内容后再生成,也可以手动整理要点。

可以编辑文字和标签吗?

可以修改描述和准确标签后重新生成。目前不提供像素、文字图层、矢量或单个元素的直接编辑。

支持哪些导出格式和尺寸?

支持 1024 × 1024、1536 × 1024 和 1024 × 1536 像素的 PNG 下载,暂不提供 SVG 或 PPTX。服务商图片链接会过期,请及时下载。